Category Archives: MH370

Drift of floating debris from close to the 7th arc in the weeks following the crash of MH370

Drift of floating debris from close to the 7th arc in the weeks following the crash of MH370

Richard Godfrey
2016 March 24th


Initial comments
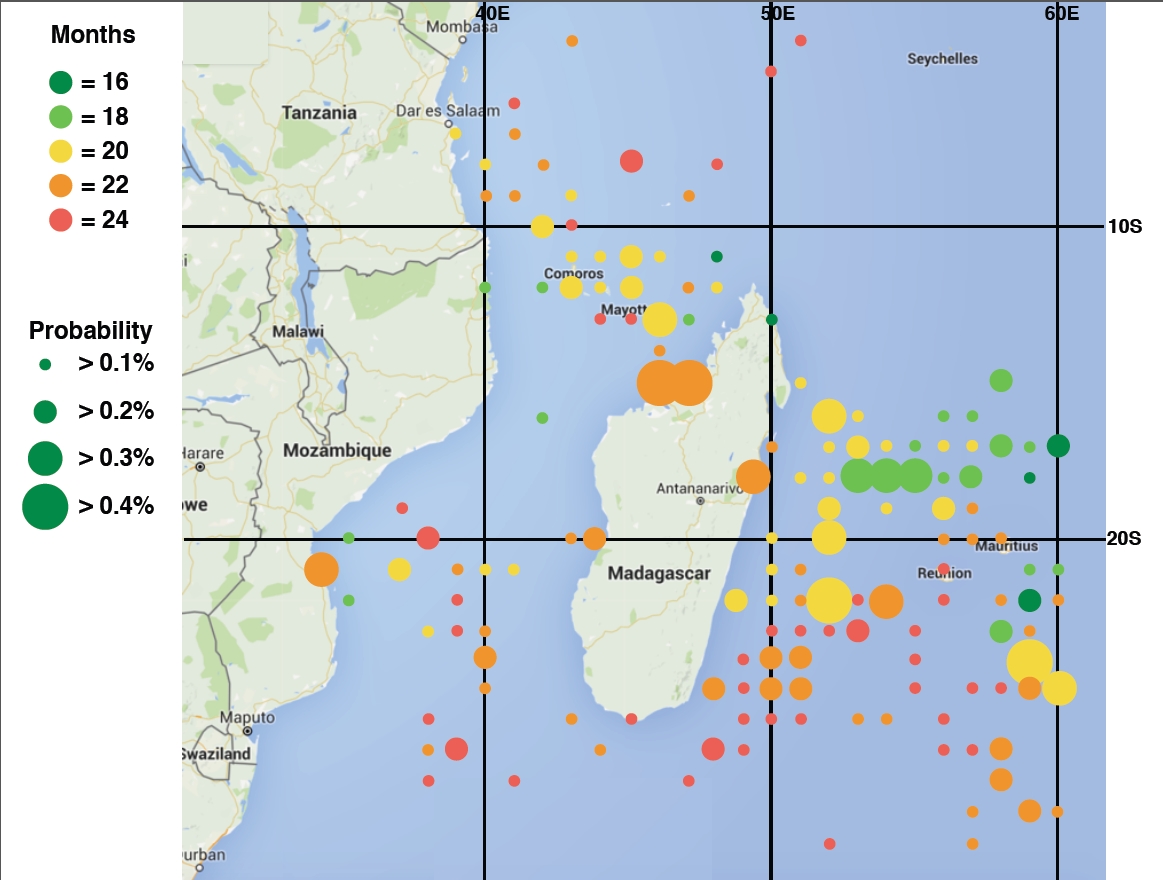
The discovery (and sizes) of several pieces of MH370 (some awaiting confirmation) in La Réunion, Mozambique and South Africa, when coupled with geographical drift probability evaluations (see this post; a much more extensive report will be published here shortly), indicates that there must have been a large number of floating objects in the initial debris field. A lower-bound appears to be about 3,000 (discrete floating pieces).

It seems infeasible that such an extensive floating debris field could be overlooked, if the search aircraft had flown over it, even if half of the items had become waterlogged sunk within a few weeks.

In the analysis presented here I have used the same techniques for modelling drift speeds and directions as applied previously (i.e. using the adrift modelling tool). In the present case I am considering short-term/limited-distance drift distances and directions. Whilst the French satellite data are from about 14 days post-crash, here I have used a canonical time step of 20 days; the resulting distances drifted are scalable.

Summary of drift outcomes
Starting at latitude 37S and on the 7th arc, floating debris would have drifted 44 NM on average after 20 days, rendering an average speed of 0.10 knots. The average bearing of the drift direction is 060° (i.e. close to northeast), with a dispersion of ±20° about that mean direction.

Starting at 34S (on the 7th arc), debris would have travelled on average 68 NM after 20 days, at a mean speed of 0.14 knots and on an average bearing of 331° (i.e. between northwest and due north), with a dispersion of ±15°.

The drift speeds found in the above examples vary from 0.05 knots to 0.22 knots. Coupled with the dispersion in drift directions indicated above this leads to an anticipation that any floating debris field will spread substantially within 20 days, and more so as time goes on. It is notable, however, that even after two months fully 69 per cent of debris items starting at 37S remain within the same geographical cell (one degree by one degree in latitude and longitude) as each other; for the assumed start position at 34S the fraction remaining within one cell is 85 per cent.

In view of this, it seems that the likelihood of the majority of debris remaining clustered after 20 days is quite high. That is, after 20 (or 14) days a debris field should still be apparent compared to the ‘background’ of other floating objects.

Graphical representation of drift patterns
Let us consider a crash having occurred mid-way between the extreme locations of the suggested ‘gap’ between 35S and 38.5S on the 7th arc.

This midpoint is located at 36.75S 90.42E (point M in the map below). The dispersion in drift after 15 days (i.e. between March 8th and March 23rd; scaled from the calculations for 20 days) would potentially be into an area defined by an inverted isosceles trapezoid, where the four corners are at the following points:

36.3748S 90.2500E
35.0970S 89.6770E
35.0970S 91.1630E
36.3748S 90.5900E

These points are plotted in the following map and labelled as M1 through M4; the points labelled F1 through F4 are the four reported items of floating debris from the French satellite(s).

Drift_trapezoids

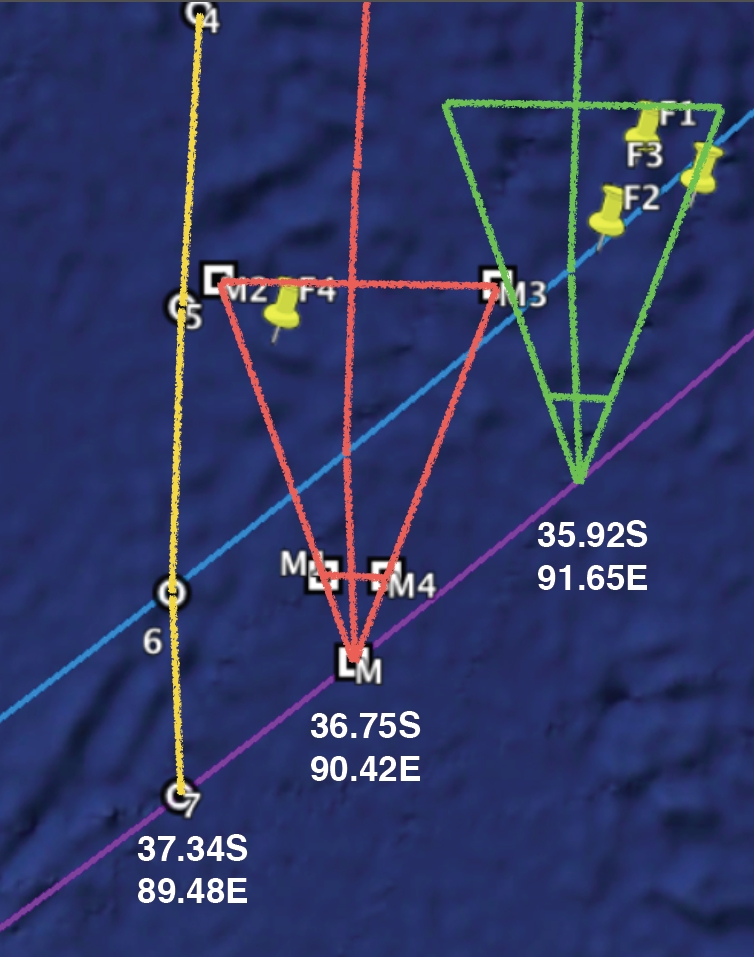
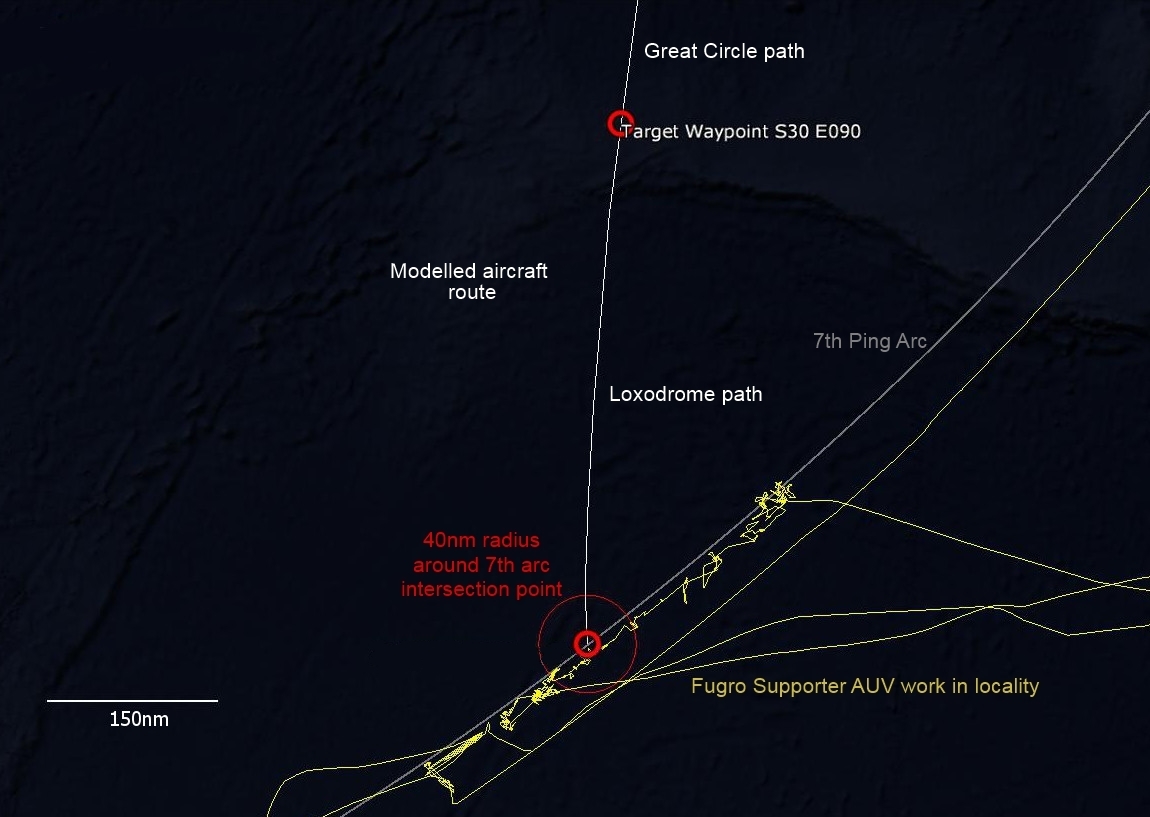
Drift patterns for crashes on the 7th arc. The purple line is the 7th arc, and the blue line is the 6th ping arc. The yellow line indicates the last part of the hybrid flight path as modelled by Thompson and Godfrey  (i.e. based on the waypoint 30S 90E, and ending up at 37.34S 89.48E.). The location labelled M is the mid-point of the ‘gap’ on the 7th arc running from 35S to 38.5 S, the red near-vertical line indicating a similarly-modelled flight path required to conclude at that point. The trapezium delineated by the red lines joining points M1, M2, M3 and M4 indicates the spread of likely positions of floating debris 15 days after a crash at point M. The green flight path is to an end point 35.92S 91.65E; this was designed to fit the French satellite-spotted positions F1 to F3 into the nominal debris drift area (i.e. green trapezoid).

The area within the trapezoid defined by M1, M2, M3 and M4 is 11,770 square kilometres. The dispersed debris would be expected to be concentrated towards the centre of this area, perhaps covering about 25 per cent of it. This assumption would indicate that after 15 days most of the floating debris would lie within an area of about 3,000 square kilometres. Thus if there were about 3,000 floating items, there would be an average of one per square kilometre, although the spatial density would be highest towards the centre of such a debris field.

This might seem to be a low spatial density (one per square km), but remember that for an aircraft flying over such a debris field the sightings would go on and on, km after km.

Discussion
Whilst three of the French-reported items are closely clustered (F1, F2 and F3) and appear to be consistent with a crash located near 35.92S 91.65E, the fourth item (F4) was spotted some distance away. It would appear unlikely that all could have originated from a single start position on the 7th arc and simply drifted that far apart in 15 days.

Of course it is not known that these four items are indeed pieces of MH370, but in order to make forward progress in this analysis, let us assume that they are. We then ask: how could F4 have shifted so far from F1, F2 and F3?

One possibility is that F4 is actually the flaperon eventually found in La Réunion (or is some similar substantial piece of debris) and was dropped from MH370 prior to its crash into the ocean. It has been suggested that the appearance of the flaperon is consistent with it having been ripped from the aircraft wing by high-speed flutter.

Another possibility that could lead to a wider spread of floating debris, some items being separated from the others, is the extent to which individual pieces extend above the water; this would, of course, be dependent upon their density. Items projecting substantially above the water could be subject to wind-blown effects independent of the ocean current drift.

The wind was variable in this area during the 15 days in question, but overall would have blown debris subject to such an effect (‘windage’) in a northeasterly direction. The average surface wind strength was 11 knots. Thus if F4 had no windage (e.g. it was the flaperon) and F1 to F3 had some windage, this would fit against the red flight path (i.e. F1 to F3 were blown NE in addition to the effect of the current, whereas F4 was subject only to the current causing it to drift). One might even be able to fit to the yellow flight path, making assumptions about the relative windage values (which, of course, I am hesitant to do here).


Note added by Duncan Steel, March 25th: The locations of the four items (F1—F4) in the above map are towards the northern extremes of the drift trapezoids as calculated by Richard. However, the assumed start points for each are on the 7th arc; and the area within 20 NM of the 7th arc has already been subject to underwater search. Assuming that the underwater search has not missed an ocean-bottom MH370 debris field in this region, it might be suggested that the aircraft crashed north of the 7th arc and outside of the area already covered by the underwater search, so that the start point for the drift was actually north of those 7th arc locations utilised by Richard in forming this map.


An Investigation of a MH370 Hybrid Flight Path

An Investigation of a MH370 Hybrid Flight Path

Don Thompson and Richard Godfrey
2016 March 12th
(Updated March 15th)


Introduction
Flight path reconstructions for MH370 have typically involved an assumed route for the final (southwards) leg defined either by a single geodesic or a single loxodrome, each beginning at the Final Major Turn (FMT) near the northwest of the Malacca Strait and leading to an intersection with the 7th ping arc in the Southern Indian Ocean (SIO).

The BFO (Burst Frequency Offset) recorded at 00:11 UTC, however, deviates from the trend of the other BFOs recorded after 18:39 (as shown in Figure 1 below), and recognition of that fact has prompted the present study in which we explore a ‘hybrid’ autopilot flight navigation scenario within which a transition occurs in the path definition in the final hour of flight.


BFO_chart

Figure 1: The values of the BFO plotted against the time (in seconds from the start of 2014 March 07 UTC). The final BFO value (at top right), which lies away from the trend line, has stimulated the present analysis, whereby a different type of path-following is taken to occur after an assumed final waypoint located at latitude 30 degrees south,
longitude 90 degrees east. 

Hybrid flight path model
The route reconstruction studied in the present report is based on the following linked-pair of assumptions:
(a) The B777 Flight Management System (FMS) was providing navigational instructions to the Autopilot Flight Director System (AFDS) via Lateral Navigation (LNAV) so as to fly the aircraft to a pilot-defined latitude/longitude waypoint [1] in the SIO; and
(b) The Flight Management Syetem (FMS) maintained the subsequent path (i.e. that taken after the overflight of the waypoint), in accord with the default reversion mode stipulated for a Route Discontinuity (according to the B777 Flight Crew Operations Manual, or FCOM [2]).

Briefly, when the FMS completes navigation to the final defined waypoint on any route it then enters the ‘Route Discontinuity’ state, but continues to provide guidance to the AFDS via LNAV. In Route Discontinuity mode the FMS guidance reverts to a simple magnetic (compass) vector as defined by the final heading of the previous leg (i.e. that maintained until the final defined waypoint was reached). That is, for the flight leg between the penultimate waypoint (in this case, likely near the FMT) and the final or ultimate waypoint the path flown would be a great circle (or geodesic); however, after passing the final waypoint the path flown is a loxodrome or rhumb line: a path with a constant bearing, with that bearing in this case being measured relative to Magnetic (rather than True) North.

Exploration of this ‘hybrid’ path reconstruction is an extension of the ‘constrained autopilot defined’ philosophy adopted by the Independent Group (IG), which searches for paths conforming with both BTO (Burst Timing Offset) and BFO data, and complies with the deterministic aircraft navigation characteristics rather than a purely data-led mathematical fit.

Previous IG modelling has explored how closely a geodesic/great circle path or loxodrome/rhumb line path can be fit to the BTO and BFO data from an assumed FMT positional fix through to a point on the 7th arc. The route reconstruction in the present case exploits something observed in these previous models: they tend to pass close to the point 30S090E (latitude 30 degrees south, longitude 90 degrees east). The route reconstruction here in this hybrid treatment is based an an assumption that 30S090E is the fix or waypoint for a final FMS ‘track-to-fix’ (TF) leg and, subsequently, the FMS reverts to a default of following a magnetic vector (MV), the non-deterministic FMS MV leg type, as indicated in the flight manuals [2]. In an ordinary flight, such a MV loxodrome would continue until manual intervention by the pilots.

While flying the terminal MV leg the aircraft track over Earth’s surface is subject to the prevailing magnetic variation, and also high altitude winds. Combining:
(i) The Global Data Assimilation System (GDAS) atmospheric observations the start of 2014 March 08;
(ii) The table of magnetic declinations or variations (2005*) for different geographical coordinates, consistent with the model apparently loaded into the MH370 (aircraft 9M-MRO) FMS; and (iii) The aircraft speed and heading at 30S090E
… the surface track for the final (MV) leg can be determined.

*The magnetic declination tables used for navigation in the FMS of modern aircraft are mandated to be updated every decade in the year ending with the numeral ‘5’.

Analysis
The BFO for the 00:11 R-channel log-on interrogation event deviates from the trend across the earlier BFOs (sparse as the trend is), as shown in Figure 1 above. The analysis we applied tested how a hybrid geodesic-plus-magnetic-north-referenced path might instead fit the BFO data.

  • The FMS, commanding LNAV via roll commands to the AFDS, will navigate the aircraft to any chosen location; an assumption we make is that that the intended destination was in the SIO;
  • A FMS track-to-fix (TF) leg is the most common element of a route definition;
  • FMS reversion at a Route Discontinuity is understood to occur [2];
  • Assuming an LNAV route, the BFO trend suggests that a Route Discontinuity occurred after 23:00 (the mean C-channel BFO is below the trend);
  • The final fix/waypoint within the FMS-computed fuel range ensures the route will be executed in LNAV and VNAV without errors.

The goal here was to identify a path for the final MV leg, starting from S30E090 due to the fact that that true-track and geodesic solutions in earlier flight models passed close to that ’round figure’ point.

Based on Richard’s MH370 Flight Model a hybrid flight path model was developed using a great circle path from a late FMT to a pilot-defined waypoint at 30S090E, followed by a constant magnetic heading loxodrome from 30S090E to an end point at that loxodrome’s intersection with the 7th arc.

A constant Mach speed (0.817) was used, because this was found to provide the best fit to the satellite data (BTO and BFO values).

The flight path after passing by 30S090E at 23:21:20 UTC was calculated in 10-minute steps, the route calculated in this way being shown in Figure 2 below. Details of the latitude and longitude of this path at different times (i.e. in 10-minute steps) are given in Table 1 below.

Hybrid-End-View-3

Figure 2: Prior to the assumed final/target waypoint and from the FMT the modelled path of MH370 follows a great circle (or geodesic); after that waypoint the path assumed is a loxodrome or rhumb line based on a magnetic reference (i.e. Magnetic North not True North). That path intersects the 7th ping arc at a point near 37.3S, 89.5E.


Results
Due to the magnetic declinations/variations and the high-altitude winds, the track changes its azimuthal direction from 187.0475°T at 30S090E (the assumed final waypoint, passed at 23:21 UTC) to 177.9864°T at the time of crossing the 6th ping arc (i.e. at 00:11 UTC). The various representations of the track or heading at different junctures are given in Table 1.

The resultant hybrid flight path reached the 6th arc at a location near 36.46S, 89.44E (see Table 1 below). This fits the BTO value obtained at 00:11 UTC to within 0.8 km.

The overall RMS BTO Error is 5.9 km, and the overall RMS BFO Error is 3.2 Hz.

Excluding the 19:41 arc (subject of a previous post on the use of further waypoints closer to the FMT), the RMS BTO rrror is 3.4 km, and the RMS BFO error is 1.0 Hz.

Extrapolating the loxodrome flight path for the final leg to the 7th arc (the subject of a previous post on the aircraft’s behaviour after flame-out), the end point obtained is near 37.34S, 89.48E (see Table 1 below) .

The relevant flight path details are given in Table 1 below.

Flight_path_table

Table 1: Hybrid-model flight details. The location given in the penultimate row (time close to 00:11 UTC) corresponds to the crossing of the 6th arc; the location in the bottom row (time 00:19:29 UTC) is the place at which this flight path crosses the 7th arc. 

Conclusion
Richard’s flight path model v16, using an assumed great circle path from a late FMT, resulted in an end point (i.e. an intersection with the 7th ping arc) near 38.19S, 88.04E. The hybrid path model described in the present report leads to an end point near 37.34S, 89.48E. If the hypothesis proposed in this report is correct — that the final waypoint available to the FMS following the FMT was the ’round figure’ of 30S090E, and after passing that location a ‘Route Discontinuity’ condition resulted in the FMS flying the aircraft on a loxodrome with a magnetic reference, in apparent accord with the FCOM  — then the latter location (37.34S, 89.48E) would be our best estimate of the place that MH370 reached the 7th arc, based solely on the satellite data.

Note that the assumption of a constant Mach speed is a feature of the model described in the present report. A refinement that might be made at some stage is that the speed between the 6th and 7th arcs might be expected to be reduced slightly due to the aircraft then operating on only one engine, this being the distinction between Richard’s flight models v16.0 and v16.1: see this post. The effect of allowing for this deceleration between the 6th and 7th arcs was found in that previous post to be a shift in the end point latitude by 0.2 degrees northwards and 0.3 degrees in longitude eastwards. Those figures compare with the shifts of 0.85 degrees northwards and 1.44 degrees eastwards found above. That is, a further shift northeast on the 7th arc would result if the falling speed at the end of the flight were included in the model applied here, but that shift would be of a lesser magnitude than the effect identified herein caused by assuming that the latter part of the flight were following a magnetic loxodrome from 30S090E, rather than a continued great circle path.

[1] Boeing 777 Flight Management System Pilot’s Guide, Honeywell, October 2001; Section 10: Advanced Flight Planning.

[2] Continental Airlines B777–226 Flight Manual, and Qatar Airways B777 Flight Crew Operations Manual, Boeing Company:  “LNAV  maintains current heading when […] passing the last waypoint prior to a route discontinuity.”


An Investigation into Indian Ocean Drift Patterns from 37S on the 7th Arc

An Investigation into Indian Ocean Drift Patterns from 37S on the 7th Arc

Richard Godfrey
2016 March 10


Introduction

The discovery of debris in the western Indian Ocean that appears likely to be parts from MH370 has stimulated fresh interest in how such debris would drift, what these items might tell us about the demise of the aircraft, and what the possible implications are for the crash location.

Assuming that MH370 crashed into the ocean in an energetic impact creating a large amount of floating debris, I wanted to investigate where such debris would end up after two years.
The searchers for AF447 recovered around a thousand pieces of floating debris following that crash into the Atlantic Ocean. There would have been more floating debris that they were not able to recover (for example, because it had already been dispersed from the crash location, or because it had subsequently sunk).
Method
I have used the drift model available from www.adrift.org.au and in particular the dataset appropriate for a start in March from a position at latitude 37 degrees south near the 7th Arc (based on the outcomes of my flight model). The ‘adrift’ model evaluates the probability of debris drifting across the ocean to specified end locations.
That dataset is available in two-month steps going forward from the start point and time. The  drift outcome is defined in terms of a probability of reaching a certain location, defined as a cell 1° of latitude by 1° of longitude.
I have restricted my investigation to the timeframe from 16 months to 24 months after the MH370 crash (i.e. between last July, when the right flaperon was found in Réunion, and the present, with two additional candidate fragments having been identified in Mozambique and in Réunion).
The adrift model essentially ignores cells rendering very low probabilities, but for each two-month step the total probability summed over all cells at that time adds up to nearly 100%. I only used cells where the indicated probability was greater than 0.1% (i.e. 0.1% of the total number of objects in the overall area being investigated, as defined below; not 0.1% of all objects that started out drifting from the crash location).
Because of the general drift pattern and the find of the flaperon from MH370 in Réunion, I restricted my investigation to the western side of the southern Indian Ocean between latitudes of 04S and 34S, and longitudes between 33E and 60E. The total area included by those bounds is about nine million square kilometres; hereafter that region is termed ‘the area investigated’.
Results
The most likely location for debris to have washed ashore already (i.e. 24 months post-crash) is Madagascar, followed by the Comoros Islands and Mayotte, Mozambique, Réunion, and Tanzania.
The total probability that floating debris will be positioned in the area investigated is 5.8%; that is, out of one thousand floating debris items starting out at 37S near the 7th Arc, 58 may be anticipated to be within the area investigated (and 942 will be elsewhere).
Of the above 5.8% estimated to be in the area investigated, about 89% is expected, based on these calculations, to still be floating on the ocean, and only 11% already to have come ashore. That is, of the above putative 58 items there would be about six already come ashore, and 52 still on the ocean within that area investigated.
The map below shows the calculated spread of debris over the area investigated.
RG_drift
An Excel spreadsheet file is available here, showing the various locations where one might expect debris to turn up on the shore.
Debris will still be arriving at the north-south line through Réunion or Mauritius (described in the Excel file as “Off Reunion” or “Off Mauritius”), but generally most floating items are now passing to the south and west; some will make first landfall in South Africa, while others may head out into the southern Atlantic Ocean.
Discussion
Assuming that MH370 resulted in 1,000 items of floating debris, then 58 items are likely to be in the area investigated.
However, only about six items would be expected have come ashore so far (Madagascar: 4, Comoros Islands: 1, Mozambique: 1, Réunion 0.5, and Tanzania 0.6). [DS: Before anyone starts shouting, these are expected figures based on an assumed one thousand items starting out. Obviously debris items are quantized in that one cannot have 0.5 or 0.6 of an item. On the other hand, it is also true that individual initial items might fragment upon reaching a shoreline. One might naïvely suggest that two items having been found in Réunion implies that at least 4,000 items of floating debris started out, but we are dealing with small number statistics here.]
The find of the flaperon in Réunion appears to have been extremely fortunate, and perhaps might imply there was a larger number of items of floating debris resulting from the MH370 crash; that is, many thousands of items.
The find in Mozambique (if it indeed turns out to be from MH370) is also against the odds, and Blaine Alan Gibson was certainly in the right place at the right time.
There are about four more items of debris perhaps waiting to be found on the north, east and west coasts of Madagascar; or, four multiplied by the number of thousands of initial floating items from the crash (assuming that none of the initially-floating items subsequently sunk).
Of the items of debris still out on the ocean — these comprising the majority — the ordering in terms of likelihood of landfall is as follows:
1. Madagascar
2. Mauritius
3. Réunion
4. Mozambique
5. Comoros Islands and Mayotte
6. Tanzania
7. South Africa
8. Aldabra
9. Seychelles
10. Kenya
That is, the locations at the top of that list are the most likely places to find more debris from MH370.
It is re-iterated that the above results were based on an assumed crash location as given in the title of this report. The results for crash locations within a degree or two of latitude of that assumed start point would be similar to those obtained here; but a start location far from that location (e.g. latitudes south of 40S or north of 25S) would lead to rather different results. That is, whilst the discovery of three items on coastlines in the western Indian Ocean (one confirmed piece from MH370 – the flaperon – and two items awaiting inspection and identification by the authorities) cannot be considered to demonstrate with certainty where MH370 crashed, the analysis presented here shows that their discovery, in terms of their locations and the elapsed time since the crash, appears to be consistent with the crash location having been around latitude 37S and close to the 7th Arc.