Category Archives: MH370

Consideration of a Controlled Ditch Scenario for MH370

Consideration of a Controlled Ditch
Scenario for MH370

Yap Fook Fah
2016 April 14


According to the Inmarsat data, there are two plausible scenarios for the terminal phase of the MH370 flight after a Final Major Turn (FMT) and about another six hours of flight southwards. For ease of reference, I will refer to these as being the Uncontrolled Dive (UD) scenario, and the Controlled Ditch (CD) scenario.

The Uncontrolled Dive Scenario
This assumes a lack of human intervention and that the fate of the aircraft was left solely to the working of its machinery. The definition of the priority zone for the undersea sonar search currently in progress is partly based on this scenario.

The location along the 7th arc has been defined and prioritized by a consideration of: (i) The so-called Constrained Autopilot Dynamics, and (ii) Data Error Optimization (Figure 1). The former assumes that the plane flew by some well-known autopilot mode, while the latter ranked potential flight paths according to how well they fit the Inmarsat data, without regard to how the flight might have been executed.

YFF_Fig1

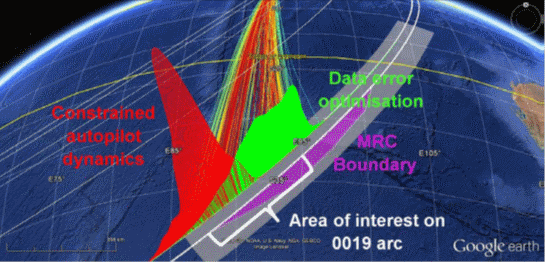
Figure 1: Representation of the probability distribution at the 0011 arc for constrained autopilot dynamics (red) and data error optimization (green). [1] 

As regards the width of the search zone transverse to the arc, until recently this was defined by an assumption that the plane flew until fuel exhaustion, and, with no one at the controls, fell rapidly from the sky into the Southern Indian Ocean. The width has recently been increased to 60 nm from the 7th arc, to account for the possibility of a glide or controlled ditch.

The UD scenario has been considered the most likely because it fits the Inmarsat data by making the fewest and simplest assumptions. However, it offers no insight into the particular choice of probable flight paths and end zone, except that they are the most consistent with autopilot flight modes and Inmarsat data. Another issue that is becoming increasingly problematic for this scenario is that the undersea sonar search has not been fruitful so far since it started in October 2014.

The Controlled Ditch Scenario
In this scenario, there was someone at the controls right until the end, culminating in a controlled ditch (CD) into the sea. Naturally, a CD scenario begs the question of who was behind the controls, and the reason for his/her action. This study does not examine the “who” or the “why” of such a CD scenario. Personally, I do not think any of the pilots was responsible as I know of no evidence whatsoever that implicates them. Let us just term the person behind the act the ‘perpetrator’.

The scope of this study, therefore, is limited to a consideration of the “what” and the “how” of a CD scenario; that is:

  • How would the position and length of the priority search zone along the 7th arc be different from that of the UD scenario?
  • How would the width of the search zone be different?
  • Given that a perpetrator did a CD, what can we deduce about the nature of the end-game flight path?
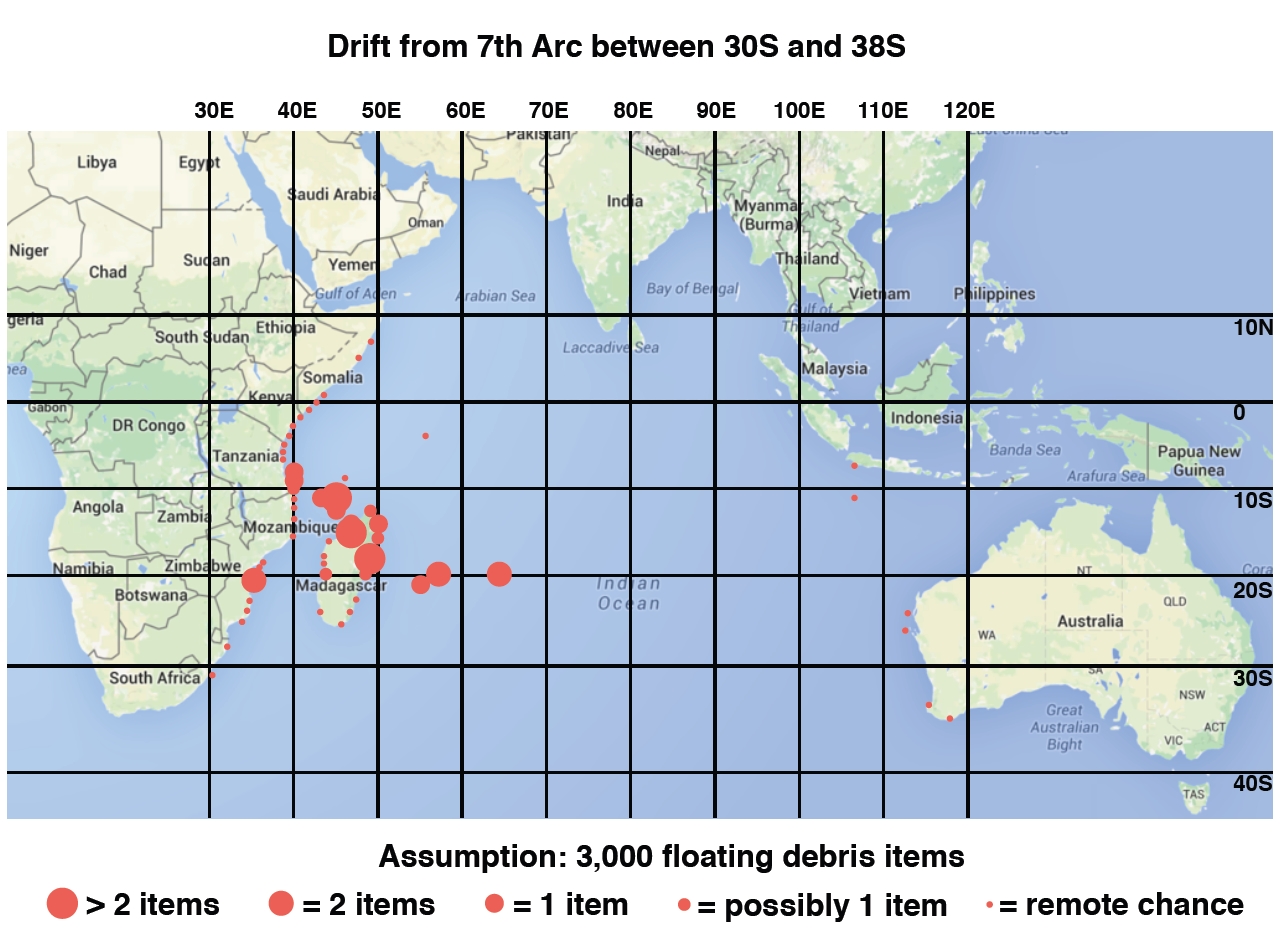
  • The recent debris finds (see the report here) imply that there was a large amount of surface/floating debris; therefore we ask how much of the potential CD areas were covered by the aerial search soon after the loss of MH370, and how much has been covered by the ongoing undersea search?

It is not immediately obvious that the hotspot defined for the current search, as well as the spread of the search zone along the 7th arc, would remain the same if the CD scenario were adopted as an assumption, rather than the UD scenario. A CD scenario implies the presence of a perpetrator controlling the final leg of the flight, and this might alter the probability distribution for the search zone because it lends more weight to certain flight modes than others.

Table 1 lays out some of the implications that could be deduced from assuming a CD.


Controlled Ditch

which further
1 implies that there was a perpetrator at the controls, implies that the perpetrator wanted to minimize the force of the final impact.
2 implies that perpetrator wanted to minimize debris, implies that number of debris found might be small, mainly exterior parts.
3 implies that action was premeditated, with an intention to make the plane vanish without trace, implies that flight route was carefully planned to avoid detection as much as possible.
4 requires that ocean surface was visible at time of ditching, implies that end point was in a daylight region.

Table 1: Implications of a Controlled Ditch scenario


Assuming that a CD implies an intention to make the plane vanish without any trace, Table 2 lays out some of the constraints on the end-game flight path.


Avoiding detection during flight and hiding the plane

1 requires that the plane flew to some remote ocean area for ditching.
2 requires that plane flew under cover of darkness to avoid satellite detection.
3 requires that plane flew to fuel exhaustion to minimize risk of explosion on impact and oil leak after crash.
4 requires that the end point is in daylight region shortly before arrival, so that the ocean surface was visible at time of ditching.
5 requires that plane flew a precise end-game path, controlled by autopilot, until the time to ditch at target area.

Table 2: Plausible constraints on the flight path. 

It is also reasonable to assume that the perpetrator did not know that the Inmarsat pings could be used to track the flight, and so the end-game flight path would just be a simple, straight path controlled by autopilot that would achieve the objectives of Table 2. Referring to Figure 1, such a path would be in the Constrained Autopilot Dynamics zone with probability distribution shown in red. In contrast, the Data Error Optimization zone (in green) would be given much less weight as they pertain to more unusual, curved paths.

The first deduction from this study, therefore, is that the CD zone (i.e. where the aircraft is more likely to have ended its flight under the CD scenario) is weighted more toward the southern end of the arc, between 35S and 39S.

Nature of the southern flight path
From the point of view of the perpetrator, a feasible approach to determining a flight path for the CD scenario involves the following steps.

Step 1: Determine the amount of fuel remaining before the FMT at around 1830 UTC, and estimate the time to fly to fuel exhaustion.

Step 2: Work out the sunrise line at, say, 15 minutes before fuel exhaustion. For example, if fuel exhaustion is estimated to be at 00:10 UTC on 2014 March 08, then at this time the plane should reach a location that has a sunrise 15 minutes earlier, i.e. at 23:55 UTC March 7. The pink line shown in Figure 2 are locations that have an apparent sunrise at this time.


YFF_Fig2

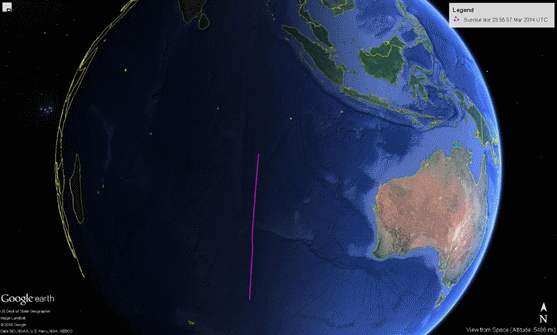
Figure 2: Sunrise line at 23:55 UTC on 2014 March 7. 

Step 3: Work out the aircraft performance boundary; for example, see Figure 3 below.


YFF_Fig3

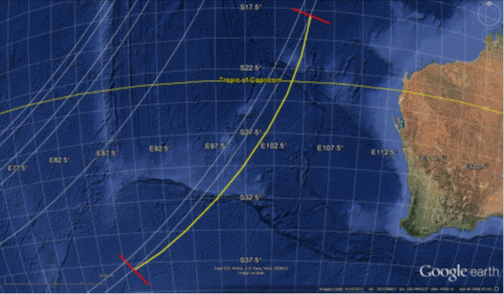
Figure 3: Aircraft performance boundary for MH370 [2]. 


Step 4: The location to aim for is then the intersection between the sunrise line (Step 2) and the fuel performance boundary (Step 3).

It might not be straightforward to work out Step 3 precisely, as the performance boundary depends not only on the amount of fuel, but also the initial position, flight altitude and flight mode. Certainly this would be difficult to work out quickly.

There is, however, a much easier way which does not require Steps 3 and 4 at all. If the plane were to fly along the sunrise line determined in Step 2, then it could be sure to reach the fuel exhaustion point at precisely 15 minutes (or whatever pre-determined time interval) after sunrise.

In Figure 4, the sunrise line for 23:55 March 7, shown in pink, is overlaid with one of the best-fit autopilot flight paths worked out from the Inmarsat data (in white, 186.7 degree rhumb line). The flight path crosses the 7th arc (in red) within the hotspot at (37.6S, 89.0E). It is a notable coincidence that the sunrise line is almost collinear with that modelled flight path.

Note that the sunrise line also crosses the position (30S 90E). These could be a simple set of coordinates to enter into the Flight Management System (FMS) as a target waypoint (as discussed in a previous post on this website).


YFF_Fig4

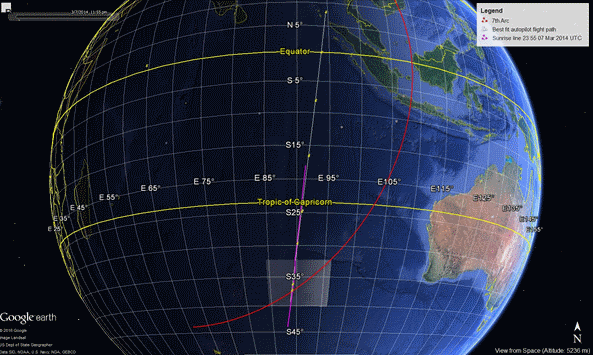
Figure 4: Sunrise line (pink) at 2355 UTC March 7 2014 overlaid with a rhumb line flight path (white) that crosses the hotpot on the 7th arc.

An animation that shows the sunrise effect as the end-game flight progressed can be obtained here. The yellow pin marks the position of the plane as it crosses the seven ping rings successively.

Extent of Controlled Ditch
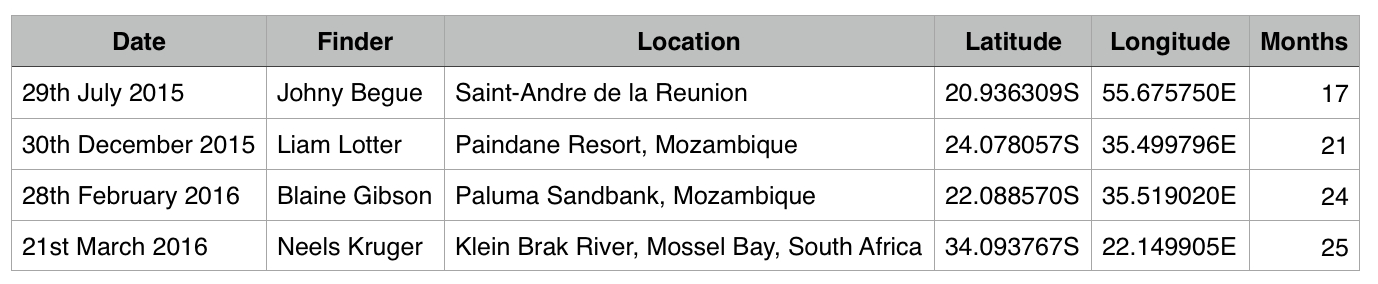
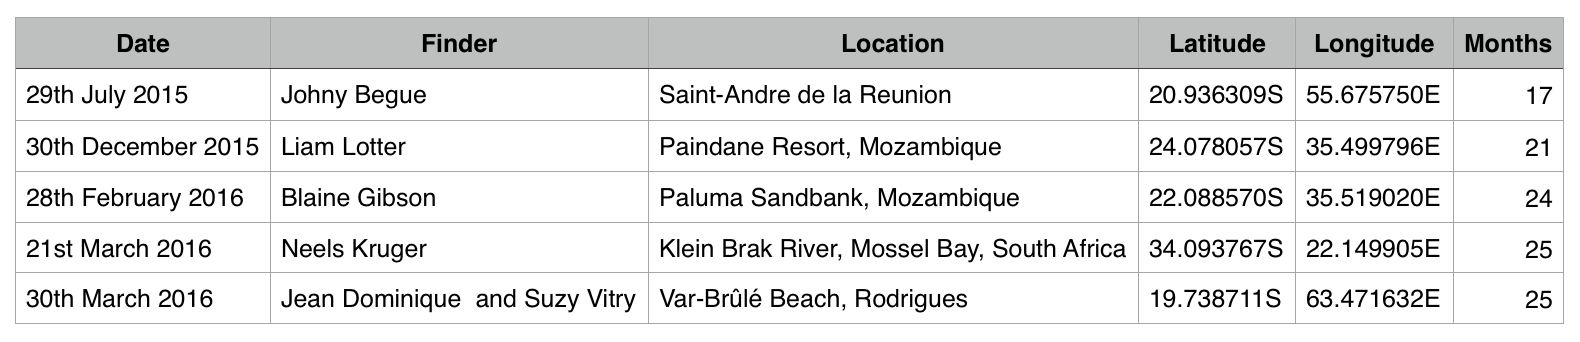
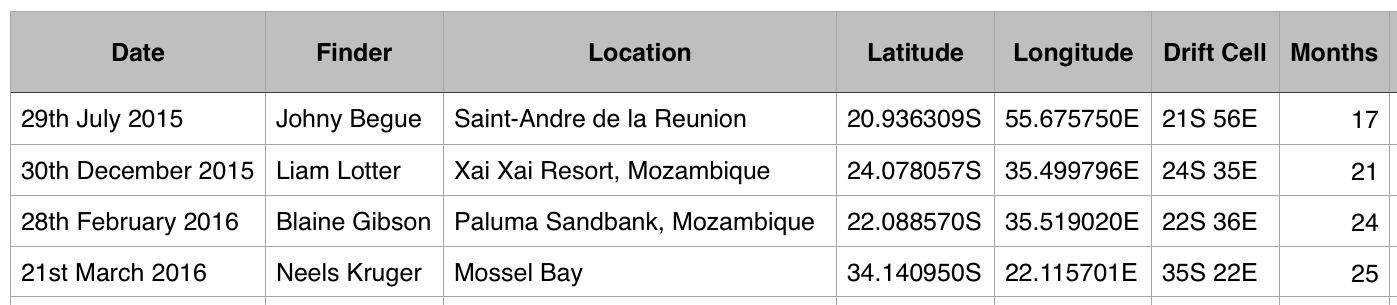
The recent debris finds, if confirmed to be from MH370, are invaluable because we could at least conclude that (i) the plane flew to the Indian Ocean, and (ii) the plane broke up on impact with the sea, whether in an uncontrolled dive or a controlled ditch. Further, the type, size and condition of the debris might further inform on the likely mode of impact. So, given that there would be surface debris even in the event of a CD, I wanted to use the approach described here [3] to check if potential CD areas have been covered by aerial and/or undersea search.

The method applied was as follows. First, I selected a straight flight path as shown above that matches the BTOs and BFOs. Next, I extended the path for another 100 nm along the same rhumb line, assuming that the plane continued to a CD sometime after 00:19 UTC. The reason for the choice of 100 nm comes from [4], where the following text appears:

Glide area
A simulation was performed to determine the glide distance of the aircraft under active control to maintain wings-level attitude. The simulation (from FL330) resulted in the aircraft gliding for a total distance of approximately 125 NM from the point of the second engine flame-out. 

In order to make this distance the aircraft would travel approximately 15 NM in the first 2 minutes of the descent (approximate time required to start the APU and initiate the log-on sequence). Therefore, from the 7th arc, the aircraft has the potential to glide around 110 NM. Due to the initial direction of travel and the wind conditions on the day, around 100 NM is a more realistic value.

The above results in Google Earth screenshots as shown in Figures 5 and 6. The aerial and undersea search areas are overlaid on the map and the daylight effect for 00:19 UTC March 08 2014 has been turned on (in Fig 5). The apparent sunrise time at 37.6S, 89.0E is 23:55 UTC Mar 07 2014 (i.e. a time stated previously above).

A second path has also been drawn in these graphics where, after reaching (30S, 90E), the plane headed directly south along 90E and flew for up to 100 nm after crossing the 7th arc.


YFF_Fig5

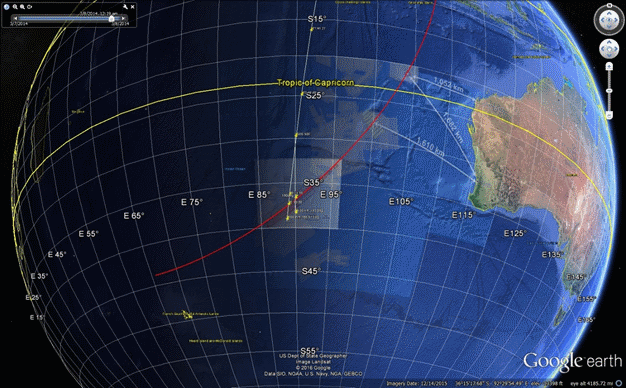
Figure 5: Modelled glide paths in the terminal phase. 


YFF_Fig6

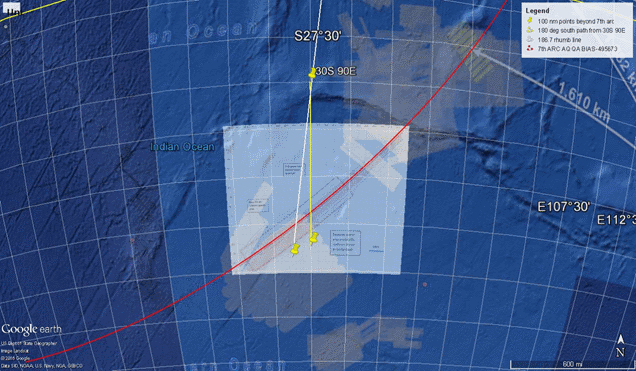
Figure 6: Zoomed in, with the solar lighting effect turned off to ease viewing. 

Observations

  1. Most potential CD end points lie within the aerial or the already-scanned undersea search zones.
  2. Only a relatively small region of potential CD end points, centred around the path along 90E, would yield debris that would have drifted outside of the aerial search zone (i.e. to the northeast of the indicated end point at 90E in Figure 6).
  3. CD end points that extend to the west of 37.6S, 89.0E on the 7th arc also lie within the aerial search zone. Further, the lack of sunlight would make visibility more difficult for any controlled ditching in this area (i.e. this far west).
  4. CD end points to the east of 90E lie outside of the aerial search zone. However, such end points might require (i) a curved path, or (ii) a straight path with some loitering around 18:25 UTC, or (iii) navigation with a set of more complex waypoints, and (iv) a longer period of exposure to daylight during the flight.

Conclusions

  1. A controlled ditch would go some way toward explaining the nature of the end-game flight path, one that was designed to be flown by autopilot under cover of darkness, and emerge into sunlight at fuel exhaustion for a controlled ditch in the Southern Indian Ocean.
  2. The length of the potential CD area spans a shorter range of longitude than the current search zone, as it is constrained by the level of sunlight and simple, straight, autopilot flight paths. It could be further limited to areas that were not covered by the aerial search in the weeks after the crash.
  3. If a CD did happen, the potential end point would appear to lie in a smaller region than initially expected: see the pink area in Figure 7.


YFF_Fig7

Figure 7: Potential CD area in pink. 

4. If the current underwater search does not find MH370 wreckage by June 2016, it does not mean that the effort has been futile and that the Inmarsat data have been invalidated. It could simply be that the assumption of a steep dive at the end (the Uncontrolled Dive scenario) was wrong. The final resting place of MH370 could lie just a little further south.

To reiterate, the intent of the analysis in this report is not to argue that a controlled ditch certainly did occur, nor to suggest any specific person or motivation was responsible if this is actually what occurred. The intent is limited to exploring the implications of such an event (a flight culminating in a controlled ditch) having occurred in terms of what this might mean for the final location of MH370 referenced against the priority underwater search zone, and also the surface areas covered in the airborne search for floating wreckage in March and April 2014.


References 

[1] MH370 – Flight Path Analysis Update, ATSB, 08 October 2014; see Figure 5.

[2] MH370 – Definition of Underwater Search Areas, ATSB, 26 June 2014; ; see Figure20.

[3] Was The MH370 Floating Debris Field Detected From Orbit? Duncan Steel, 23 March 2016

[4] MH370 – Definition of Underwater Search Areas, update, ATSB, 03 December 2015; see page 14.


The Routes Taken by Floating Debris from MH370

The Routes Taken by
Floating Debris from MH370

Richard Godfrey
2016 April 2nd

(Please see also the addenda at the end of this post, including that inserted on April 4th in which the Rodrigues fragment is identified in terms of which part of the cabin it comprised.) 

 
Preamble by Duncan Steel: 
Since I received the following material for posting from Richard Godfrey about 23 hours ago, a further piece of MH370 has apparently been found on the island of Rodrigues. Independent Group (IG) member Don Thompson has been central in identifying this as likely being a piece from the passenger cabin interior: see this early story in the media.
Before saying more on the significance of that, I might quote from the previous post by Richard, in which was written: “The next most likely destinations are Mozambique, Rodrigues, Mauritius…” One of the hallmarks of a viable scientific hypothesis is its ability to make predictions that are borne out by future observations or measurements.
My immediate response to the Rodrigues item is that, assuming that it is indeed from MH370, it provides another vital indication of the end-of-flight circumstances which could and should inform the ocean bottom search for the wreckage of MH370 and thus the flight recorders. The important thing here is that this is from the interior of the aircraft. The previous four fragments found were parts of the exterior. So long as only exterior fragments had been found, it was still possible to imagine that the aircraft had undergone a controlled ditching in the ocean, based on the idea that those pieces had been ripped off as the aircraft glided down onto the sea surface. The discovery of an interior cabin part indicates rather strongly that the aircraft disintegrated on arriving in the sea: it was a high-speed, uncontrolled crash, as has been argued many times on this website, for many reasons (e.g. the final BFO values are indicative of a very rapid, accelerating descent).
Richard’s analysis of the oceanic drift of floating debris from MH370, based on the model available on the Adrift website (to which another tip of the hat is due), has a wide variety of outcomes in terms of general understandings. An important one is this: the probabilities derived for arriving at the various locations in the western Indian Ocean where MH370 debris has been found may be inverted so as to derive an estimate of how many individual fragments were left floating on the ocean after the crash. The answer is: upwards of 10,000. In itself that number indicates that the final demise of MH370 was a highly-energetic crash.
From the perspective of the underwater search for the wreckage of MH370 there are two important points to be made, to the general reader of this post but most importantly to the people leading the official search program:
(1) There must have been a vast field of floating debris from the crash, which dispersed over following weeks: if it was not seen from the surface-search aircraft then it seems very likely that the crash must have been in a location not covered by those aircraft; the obvious implication of this is: the ocean bottom search should be directed towards areas close to the 7th arc that were not covered by the airborne search (so, see this post and this post).
(2) Whilst there was a large number of floating objects produced in the crash, there was surely also a large number of non-floating objects! That is, at the crash location there must have been many thousands of fragments with densities greater than unity, which sank immediately (unlike, say, suitcases which might take a while to become waterlogged and then sink elsewhere). The implication is that the debris field on the ocean bottom will be spread over some substantial area, dependent on various things such as the depth of the ocean at that location, rather than being a single point or restricted area where the aircraft sank largely intact. Clearly, it didn’t.
The important argument I wish to make here is that the swathes being scanned across the ocean bottom could be quite widely spaced, with spaces left between them to be covered later if required. It’s not necessary – indeed it is counter-productive – to have scan swathes that abut each other.
Before I pass the text over to Richard, here is a matter disconnected from the above, but referring to his post below. Richard has considered various mechanisms that might explain why the flaperon found on La Réunion was encrusted with many goose barnacles, whereas the three debris items discovered on the coast of Africa appeared to be bare of marine growths. One point he did not mention is this: that the ability of those three items to float and so reach the destinations where they were found may have been conditional upon them not being weighed down with barnacles. It might be the the flaperon had an average density (we still await public disclosure of the results of the tests conducted by the French authorities) low enough such that it could continue to float on the ocean despite its crustacean passengers, whereas the smaller items found in Mozambique and South Africa has densities only just less than one gram per cubic centimetre, such that any barnacles would have sunk them.
Finally I note that the initial photographs of the item found on Rodrigues indicate that it was carrying many barnacles.

Introduction 
At the time of writing [DS: that was on March 31st/April 1st], there have been four finds of floating debris items that have either been confirmed or are considered highly-likely to be from MH370 (i.e. the Boeing 7772H6ER aircraft registered as 9M-MRO), as listed in the table below. It may be anticipated that more discoveries of fragments of the aircraft will be made in coming months, spread over the shores of the western Indian Ocean and eventually elsewhere.
MH370_first_four_fragments
In two recent posts (linked here and here) I have described my investigations of the dispersal by ocean currents of floating fragments from assumed crash locations in the eastern Indian Ocean, close to the 7th arc and between latitudes of 30S and 38S, and indicated both (i) where such items are more likely to wash ashore in the western Indian Ocean, and also (ii) the most likely origination (i.e. crash) locations between the above assumed limits. Such drift analyses should be regarded as being statistically-indicative, but by no means definitive: it is simply infeasible to trace the chaotic drift of specific items either in the forward- or backward-directions.
The first find (the flaperon discovered on La Réunion) carried a large and obvious population of barnacles, whereas the other three finds in the table above display a puzzling lack of evidence of marine life in publicly-available photographs; note, though, that examination and species identification has not yet been completed or published.
One possible explanation for this obvious difference between the flaperon and the other items might be linked to the differing routes taken by the floating debris, and this is a matter which I address in the present report.
There are warmer and there are colder ocean currents. There are variations in the nutrients in different ocean areas that are required to support different types of marine life. How might such considerations affect the growth of barnacles and other organisms on the floating debris?
Methodology
The Indian Ocean South Equatorial Current drives floating debris generally westwards towards Africa. Madagascar, with a total coast line length of 4,828 km, then forces a divide of that broad current around its northern and southern tips. Whilst the currents are seasonally-variable, there are many maps available on the internet which indicate the divide being discussed herein, such as that shown below, or this one.
RG_currents_1
General map of Indian Ocean currents, with the 7th arc between 30S and 38S broadly indicated in dark blue and the first four debris finds (locations as listed in the table above) marked in red. 
According to the Adrift model, 28 per cent more floating debris (i.e. a 56/44 split) would travel via the northern tip of Madagascar, for items originating between 30S and 38S on the 7th arc (see my previous post for more information). The highest drift probabilities around both the northern and southern tips of Madagascar, are just off the coast rather than further offshore, as one might imagine. The time taken to reach the northern and southern tips of Madagascar ranges between 12 and 16 months (from the starting locations as given above).
I downloaded forward-drift data from the Adrift website for both the northern tip of Madagascar at 12S 49E and the southern tip at 26S 46E for the months of January, March, May, July, September and November. As aforementioned, there are significant seasonal changes during the year.
Although the shortest routes to the Paindane (Mozambique), Paluma (Mozambique) and Mossel Beach (South Africa) debris finds are all from the southern tip of Madagascar, it happens that all three locations could be reached by the drift patterns via either northern or southern tips of the island. That is, the fragments could have taken routes either north of the island and down through the Mozambique Channel (perhaps joining the Agulhas Current), or else passing south of the island. But which is the more likely, in each case?
Results
The Paluma find is 1.5 times more likely to have arrived via the northern route; that route is also a much better fit to the time of discovery (end of February).
The Paindane item is 33 times more likely to have arrives via the southern route; that route is also a better fit to the time of discovery (end of December).
The Mossel Bay fragment is 3.7 times more likely to have arrived via the southern route; that route is also a better fit to the time of discovery (mid-March).

As a general statement (for these and likely — based on the drift modelling — many impending discoveries) it is conceivable that times of landfall and times of discovery may be separated by some months, especially in remote areas. In the four cases in the table above, however, it appears that the areas were regularly visited, so that the discoveries were made quite promptly after the items washed ashore.

It is also conceivable, even likely, that floating items might make landfall but return to the sea, perhaps washing up again in much the same location, or some distance away. The Adrift model incorporates such a feature (that is, floating objects are assumed to be reflected rather than absorbed by a shoreline).
Discussion 
 
(1) Implications of Indian Ocean sea surface temperatures 
The ATSB has pointed out that a southern drift route generally occupies cooler waters than a northern route, and of course that is generally the case for routes south of the equator.
The graphic below comprises an overview of Indian Ocean sea surface temperature for each month of the year (thanks, Barry Martin).
 Indian_Ocean_monthly_temperatures
Indian Ocean sea surface temperatures for each month of the year. 
It would appear obvious that both a northern drift route to 12S 49E (i.e. the northern tip of Madagascar) and a southern route to 26S 46E (i.e. the southern tip) must spend significant time above latitude 30S, where barnacles apparently start to grow, although a path passing close by the southern tip might avoid spending much time to the north of 30S.
The three fragments found on the African coast 
If floating debris took a path passing slightly further south of Madagascar then it could remain in colder waters (especially between July and October) below 30S, under which circumstance barnacle attachment and growth is contra-indicated. Thus it might be that the three items found on the coast of Africa reached their destinations via such more-southerly routes. Let us examine each in turn.
The Paluma item (‘NO STEP’) that arrived at around 22S might have been expected to show evidence marine life, because it most likely (from the drift modelling) followed a northern route in warmer waters; on the other hand, if no marine life attachments are/were identified, this might be interpreted as evidence that it took the southern route. (From the preceding discussion: 1.5 times more likely to have followed the northern route based on the drift modelling, and therefore a 40 per cent chance that it took the southern path.)
The Paindane item (‘676EB’) discovered at around 24S may well show some evidence of marine life, even though it most probably arrived via the southern route past Madagascar, mainly occupying cooler waters.
The Mossel Bay find (‘Rolls Royce’) might not be expected to show evidence of marine life because it was discovered at around 34S and may well have spent most of its ocean transport time in the cooler waters below 30S.
Modelled route of the flaperon to La Réunion 
Contrasting with the above three items, the flaperon found in La Réunion at 21S carried many barnacles. Its estimated track is as below, based on an assumption that it started from close to the 7th arc between 34S and 37S.

Flaperon_drift

As can be seen, such a route would lead to the flaperon spending most of its drift time above 30S, thus perhaps enabling the substantial barnacle growth witnessed.

(2) Implications of Indian Ocean chlorophyll concentrations
At the base of the ocean food chain are single-celled algae and other plant-like organisms known as phytoplankton. Like plants on land, phytoplankton use chlorophyll and other light-harvesting pigments to facilitate photosynthesis. Where phytoplankton grow depends on the available sunlight, temperature, and nutrient levels. Because cold waters generally contain more nutrients than warm waters, phytoplankton tend to be more plentiful where the sea is cooler.
Marine growth (e.g. barnacles) on floating items is dependent upon the availability of their respective nutrients in the water, in this case the phytoplankton. Thus if phytoplankton concentrations are low, one may expect barnacle growth to be limited.
Measured chlorophyll concentrations may be interpreted as being indicators of phytoplankton levels. In the Indian Ocean the chlorophyll concentration varies considerably, for example due to the prevailing winds and other seasonal effects. In general, coastal regions (due to run-off nutrients) and colder waters (due to upwelling nutrients) are higher in chlorophyll concentrations.
In the following maps the chlorophyll concentrations are shown, scaled from purple/blue representing the lowest to yellow/red the highest, for the months May-June and September-October.
Indian Ocean chlorophyll May-Jun
Indian Ocean chlorophyll Sep-Oct

Although it appears likely that the floating debris from MH370 was carried westwards towards Africa by the Indian Ocean South Equatorial Current through warm waters (i.e. where barnacle attachment and growth is feasible), these waters have relatively low concentrations of chlorophyll in the maps above, and therefore limited amounts of phytoplankton, and this militates against substantial barnacle growth.

As floating debris spends time in coastal regions, higher concentrations of chlorophyll/phytoplankton and hence macroscopic marine life are experienced. One possibility, therefore, is that the flaperon found in La Réunion spent some time near the coast before landfall, whereas the coastal Africa finds beached as soon as they arrived.

Addendum from Richard Godfrey: The discovery of a fragment of the interior of MH370 on the island of Rodrigues, as discussed by Duncan in his preamble above, means that the list of debris finds should now be expanded, as below:
Debris Finds

Addendum from Don Thompson: An alternative reason for the Réunion and Rodrigues items being barnacle-encrusted but not the other three might be as follows. The lepas (goose barnacle) colonisation may be a feature of proximity to coastlines inhabited by lepas colonies. Therefore, debris ‘dropped’ into a mid-ocean region (i.e. the crash site) might be expected to be ‘clean’ of lepas barnacles until free-swimming barnacle nauplii, released from reproducing coastal colonies, are encountered. That would fit with Réunion and Rodrigues, contrary to the sandy-shored arrival locations of the other items so far discovered.  Colonisation of 9M-MRO debris by barnacles should generally be expected to be sparse.

Addendum April 4th, from Don Thompson:  With respect to the fragment of the aircraft found on the beach in Rodrigues, it appears that Annette in Australia has identified rather precisely which part of the cabin it came from; see the edited and marked-up photograph here. One might watch, also, the final ten seconds of this YouTube video.

Destinations of Floating Debris from MH370 Starting on the 7th Arc between 30S and 38S

Destinations of Floating Debris from MH370  Starting on the 7th Arc between 30S and 38S

Richard Godfrey
2016 March 30th
Updated March 31st
(Report drafted March 16th)


Introduction
In a previous post I investigated the drift patterns across the Indian Ocean of floating debris from MH370 starting at an assumed crash location at latitude 37S and on the 7th arc, using the Adrift model. I have now widened my analysis to include all start points on the 7th arc between 30S and 38S, and summarise the results in the present post.

This analysis covers the time frame from 12 to 24 months after March 2014 (i.e. essentially, through to the present, when parts from MH370 are being found in the western Indian Ocean and beyond [Mossel Bay]), with the time/location mapping comprising 60,270 cells whose centres range in latitude from 21N to 44S, and in longitude from 8E to 149E. This area includes coastlines from Somalia to South Africa, and from Java to Australia.

A clarification of the mapping may be useful, this mapping having been done both in a geographical sense, and also a time sense. First, on the geography. The latitude and longitude bounds given above represent a total number of 1° × 1° cells equal to 66 × 142 = 9,372. However, many of those cells are entirely covered by land, and so floating debris cannot drift into or through them! Second, the drift modelling comprises two-month steps stretching from 12 months to 24 months post-crash, counted inclusively; that is, there are seven time junctures involved (12, 14, 16, 18, 20, 22, 24). These might be considered as being ‘snapshots’ of the situation with regard to the overall drift paths of the floating debris items. A probability cut-off of 0.00025 (one part in 4,000) is applied to each cell at each time step, and only those cells having probabilities of at least that value at that time are represented in the spreadsheet. This results in the 60,270 cells stated above, and that is the number of data rows in the analysis spreadsheet that is described and linked below. Thus it is feasible that some geographical cells may appear in the spreadsheet at every time step, but it is also possible that many cells may appear only spasmodically, or not at all, because debris is very unlikely to have reached them (or remained within them) over the 12—24 months considered.

The time steps are two months long, as aforementioned; at a typical average speed of 0.1 knots such a time step represents a distance travelled of about 144 NM. The drift cells are one-degree wide in both latitude and longitude (i.e. up to about 60 NM across).


Results
The results of this analysis are available in an Excel spreadsheet.   Within that spreadsheet I have highlighted in green the potential landfall locations (i.e. those geographical cells that contain a coastline). The latitude and longitude of the centre of each cell is given by the numbers in columns C and D of the spreadsheet.

Also highlighted in the spreadsheet, in red, orange or yellow, are three geographical locations where confirmed finds of MH370 debris have been made. Those locations are given by the first three rows in the table below:

MH370_4_debris_items

The Mossel Bay item has not yet been included as a ‘find’ in the spreadsheet, pending its confirmation (plus, indeed, another potential find in South Africa announced in the past few days).

The red/orange/yellow scale indicates the probabilities, in descending order, that the landfall at each of those three places was in a certain time slot between 12 and 24 months (those time slots being indicated by the values in column B of the spreadsheet) given an assumed start latitude on the 7th arc (as indicated by the values in column A), the calculated probabilities in all cases being given by the number in column E.

Based on an assumption that there were 3,000 floating debris items, by multiplying the probabilities in the spreadsheet by that number I was able to produce a map as below, indicating where (and how many) items might be anticipated to have made landfall by now. (This assumed number — 3,000 — represents a form of normalisation: it is the required initial number for there to be at least one item being found found on La Réunion. In reality the number of floating debris items might well be substantially higher.)

Indian Ocean Drift Map

Comparing the map above (for start locations spread between 30S and 38S on the 7th arc) with my previous map (pertaining to a single start point at 37S on that arc), the most likely locations for items to reach remain the northwest and east coasts of Madagascar, as well as the island of Mayotte at the northern end of the Mozambique Channel (> 2 items). The next most likely destinations are Mozambique, Rodrigues, Mauritius, La Réunion, the Comoros, and Tanzania (at least one item each).

Note that the map above indicates only debris item locations where landfall has occurred. The previous map included items (indeed, the vast majority) still at sea.

Conclusions
The most likely landfalls (i.e. the largest dots in the map above) are from a starting point on the 7th arc at 33S, but there is little difference between starting points ranging from 30S to 38S. All high-probability end points are reached from all starting points on the 7th arc between 30S and 38S.

The most likely starting point on the 7th arc for the three confirmed MH370 debris finds (i.e. the flaperon in Réunion, and the two items found in Mozambique and recently stated to be almost-certainly from MH370) is 30S, but there is little difference between starting points ranging from 30S to 38S. Future debris discoveries and the confirmation of already-found items (e.g. the Mossel Bay fragment; see below) will enable this line of drift analysis to be extended.

Whilst I would not want to draw any conclusions from the drift modelling alone, the above confirms that the discovery of floating fragments from MH370 coming ashore now is consistent with the crash having been close to the 7th arc and between 30S and 38S. There appears to be a preference for latitudes towards the northern half of that range, but ocean drift modelling is not (and cannot be) deterministic, as such.

There are other lines of evidence that support a crash at between 30S and 34S. In preceding posts a variety of possible flight paths, including hybrid routes, have been investigated. In a post in early January an analysis by Henrik Rydberg was included, this concerning comparative likelihoods of ending up at different latitudes on the 7th arc based on the assumed autopilot roll mode. Henrik showed that the ‘Normal’ modes (either Magnetic Track or Magnetic Heading) produced latitudes generally north of the ‘True’ (Track or Heading) modes, mostly between latitudes 30S and 34S. Professional pilot opinion (as pointed out by Mike Exner) has consistently been that for an autopilot-directed flight continuing past a last-entered waypoint, the Normal (i.e. Magnetic) modes are the most likely to be followed.

There are also, though, lines of evidence that count against a crash at 30S-34S. Pre-eminent is the flight-path modelling based on the Inmarsat data, but there is also the fact that the airborne search for floating debris in the weeks following the crash covered much of the 7th arc between 30S and 34S without identifying the extensive debris field that surely existed. Note that the 7th arc between 34.5S and 37S was not covered in the airborne search. Once more fragments of MH370 are found, the balance of probabilities based on drift modelling may well shift back slightly southwards towards that gap.


Mossel Bay debris find
This item has yet to be confirmed to originate from MH370, but obviously it seems very likely to be so.

I have used the Adrift model to calculate the probability of an item of floating debris reaching Mossel Bay in South Africa from the 7th arc (and somewhere between 30S and 38S) after 24 months. The result is 0.027 per cent. To render a probability of one item of floating debris reaching Mossel Bay after this interval, 3,700 floating debris items must have started in the water at the 7th arc.

Notwithstanding the above (i.e. I tried all start locations between 30S and 38S), the only starting points that deliver debris to Mossel Bay are between 30S to 34S, with 30S to 32S being the most likely.

The time frame for the first arrival is 21 to 25 months, where 23 months is the most likely.

Note that, according to the drift modelling described herein, Mossel Bay was not the most likely place in South Africa for debris to be found at this juncture: in the map above there is a larger probability further northwards on the eastern coast of that country. A general picture that emerges is that floating items from MH370 may be moving slightly faster than the Adrift model predicts.


Notes on the lack of debris from Air France flight AF447

Some people have asked the following basic question: “How is it possible that we have several pieces of debris from MH370 found onshore after two years, but no one has claimed to have found any AF447 debris washed up on a coastline after six years?” This is a valid question to ask, and it can be answered as follows.

About a thousand items of floating debris were recovered from the ocean in the case of AF447, but none in the case of MH370. This reduces the odds to start with: some substantial fraction of the floating debris from AF447 was cleaned up, in essence.

Further floating debris quite likely will have escaped the AF447 search, but some will have become water-logged and subsequently sunk.

For the rest of the floating debris, in the six years and (almost) ten months since the AF447 crash, the most likely landfall locations are as follows (in descending order of probability):
Cameroon
Equatorial Guinea
Gabon

These three countries have a combined coastline of 1,583 km and are sparsely populated, apart from Douala and Libreville. They are not major beach tourism centres (unlike La Réunion and various other places in the western Indian Ocean). One might note that such tourism could enhance the likelihood of aircraft debris being recognised in at least two different ways: (a) The tourists tend to be more aware of the possibility of debris from air crashes than the local population, and of course they mostly flew to the resorts themselves; and (b) Beach resorts and/or local authorities employ staff to keep the beaches clean of flotsam (as indeed is the specific case of Johnny Begue in La Réunion).

Returning to the question of AF447 debris, many other destination countries are possible candidates but with much lower probabilities than the above three nations. The following were selected simply to show the wide spread that is feasible after six years have elapsed:
Nigeria
Ghana
Barbados
Spain (northern coast)
British Virgin Islands
Bahamas
Turks & Caicos Islands