All posts by Duncan

The long hunt for a diversion airport

The long hunt for a diversion airport

Richard Godfrey
18th October 2016
Introduction
MH370 passed waypoint IGARI at 17:20:31 UTC, and its transponder apparently stopped sending within one minute of passing that waypoint. Similarly, the VHF radios and SATCOM stopped transmitting at around the same time (source: Malaysian Factual Information, ADS-B, ATSB, DSTG).

Where did MH370 go from there and why?

Here is an attempt to answer that question. 

Statements below such as “MH370 passed close to WMKC” should be understood to mean “under this working hypothesis, MH370 is assumed to have passed close to WMKC ” (and similarly elsewhere).


Diversion 1
At this point, just past waypoint IGARI, the nearest diversion airport  with an adequate runway, was at Kota Bharu (WMKC), at a distance of 89.6 NM (11.2 minutes flying time) on a bearing of 241.5°T.

MH370 initiated a turn back at 17:21:53 UTC toward WMKC.

MH370 passed close to WMKC at 17:36:33 UTC, but it was decided not to attempt a landing.

WMKC only operates from 06:00 to 23:30 local time and therefore had been closed for 2 hours.

A Boeing 777-200ER with Trent engines has a maximum landing weight of 213,180 kg. The weight of MH370 at 17:36:33 UTC is estimated at 214,736 kg. This is over the maximum landing weight, but that would not have prevented an attempted landing in an extreme situation. 


Diversion 2 
At WMKC, the nearest next diversion airport was at Penang (WMKP), at a distance of 137 NM (15.5 minutes flying time) on a bearing of 242.8°T.

MH370 passed close to WMKP at 17:51:43 UTC, but it was also decided not to attempt a landing.

WMKP operates 24 hours but with restrictions. There are currently no scheduled arrivals or departures between 00:40 and 06:25 local time. MH370 passed by at around 01:51 local time.

The weight of MH370 at WMKP is estimated at 213,085 kg and marginally within the allowed maximum landing weight.


Diversion 3 
At WMKP, the nearest diversion airport was at Langkawi (WMKL), at a distance of 72.4 NM (8.3 minutes flying time) on a bearing of 330.7°T.

WMKL only operates from 07:00 to 23:00 local time. A diversion to WMKL was not attempted.

MH370 proceeded across the Malacca Straits toward waypoint VAMPI, where fuel could be dumped or at least used up (if the fuel dumping pump had failed). This would reduce the risk incurred in any emergency landing. 


Diversion 4 
At waypoint VAMPI in the Malacca Strait, the nearest diversion airport was at Phuket (VTSP), at a distance of 126.1 NM (14.7 minutes flying time) on a bearing of 20.3°T.

VTSP operates 24 hours and is quite a busy airport serving the tourist area in Southern Thailand. A diversion to VTSP was not attempted.

MH370 proceeded on Flight Route N571 up the Malacca Strait.


Diversion 5 
At waypoint NILAM, the nearest diversion airport was at Banda Aceh (WITT), at a distance of 82.6 NM (10.1 minutes flying time) on a bearing of 205.1°T.

WITT only operates from 07:00 to 18:00 local time. A diversion to WITT was not attempted.

MH370 proceeded on Flight Route N571 toward the Andaman Islands.


Diversion 6 
At waypoint IGOGU, the nearest diversion airport was at Car Nicobar (VOCX), at a distance of 118.4 NM (14.4 minutes flying time) on a bearing of 307.1°T.

VOCX is operated by the Indian Air Force and is seldom used for commercial traffic. It does not operate 24 hours. They even let cattle stray onto the runway and there is a cautionary note in the pilot’s guide for VOCX to this effect. A landing at VOCX was not attempted.


Diversion 7 
At this point you run out of diversion airports that are close by.

The next diversion airport would be Colombo Airport (VCBI) but that is 777 NM and 1.5 hours away.

Colombo Airport operates 24 hours and is quite busy, but if you have a problem with the transponders, VHF radios and possibly even the aircraft lights (navigation and landing lights might have failed due to an electrical problem), you would prefer a quiet airport.

It is easier to land in the daylight than at night (especially without functioning landing lights), so going further west is not the answer to being able to land in daylight, you should rather head east and south.

Sunrise on 8th March 2014 was at 07:22 local time in Kuala Lumpur, but at 05:06 local time in the Cocos Islands.

Cocos Island Airport (YPCC) has an adequate runway and is a quiet airport with little traffic, and MH370 could make it there just before sunrise. 

Hypothesis: MH370 turned south east on a bearing of 169.4°T for Cocos Island Airport.

Obviously, MH370 did not land at Cocos Island Airport either and appears to head at first for Learmonth (at the NW tip of Australia) and later for Perth instead (neither of were reachable with the remaining fuel). 


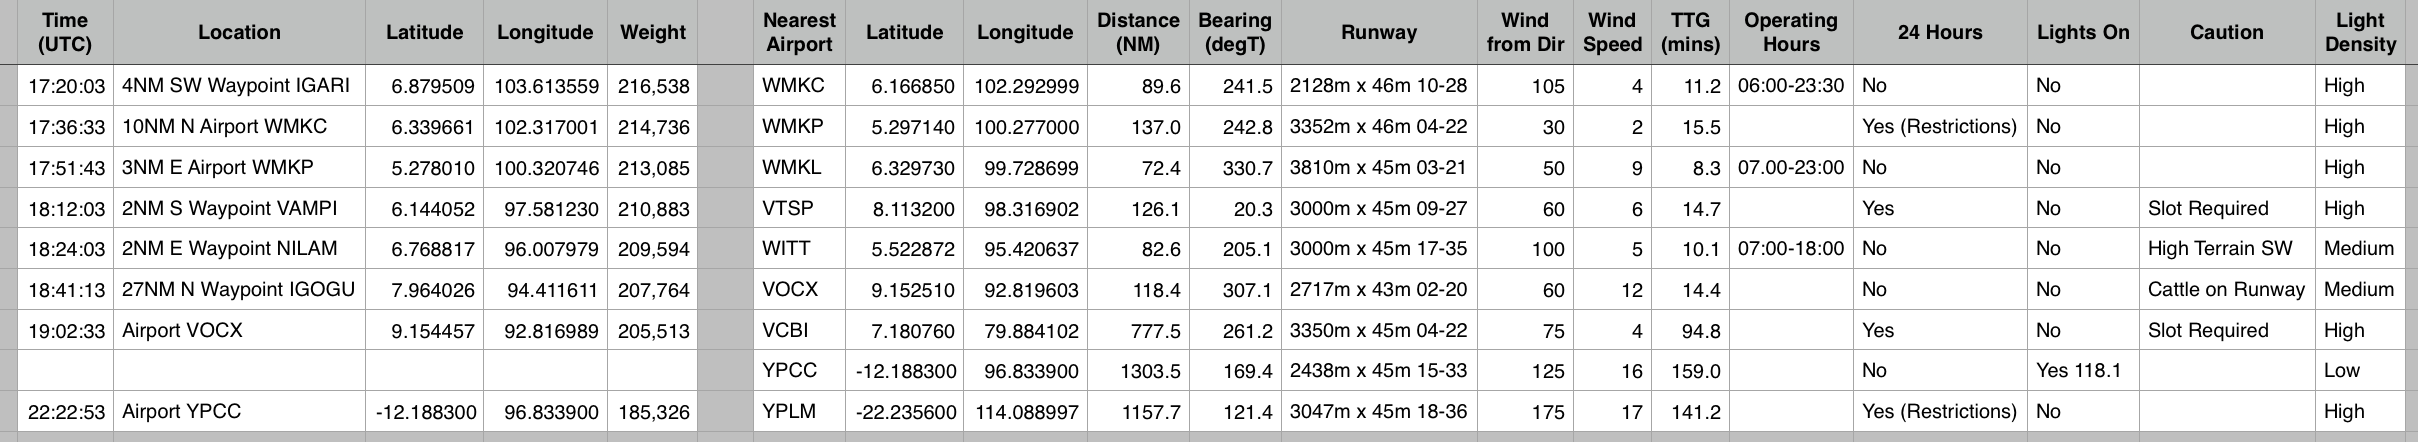
Airport Surface Winds 
In all cases, the surface winds at each possible diversion airport were light and would not have prevented an attempted landing (see table below).
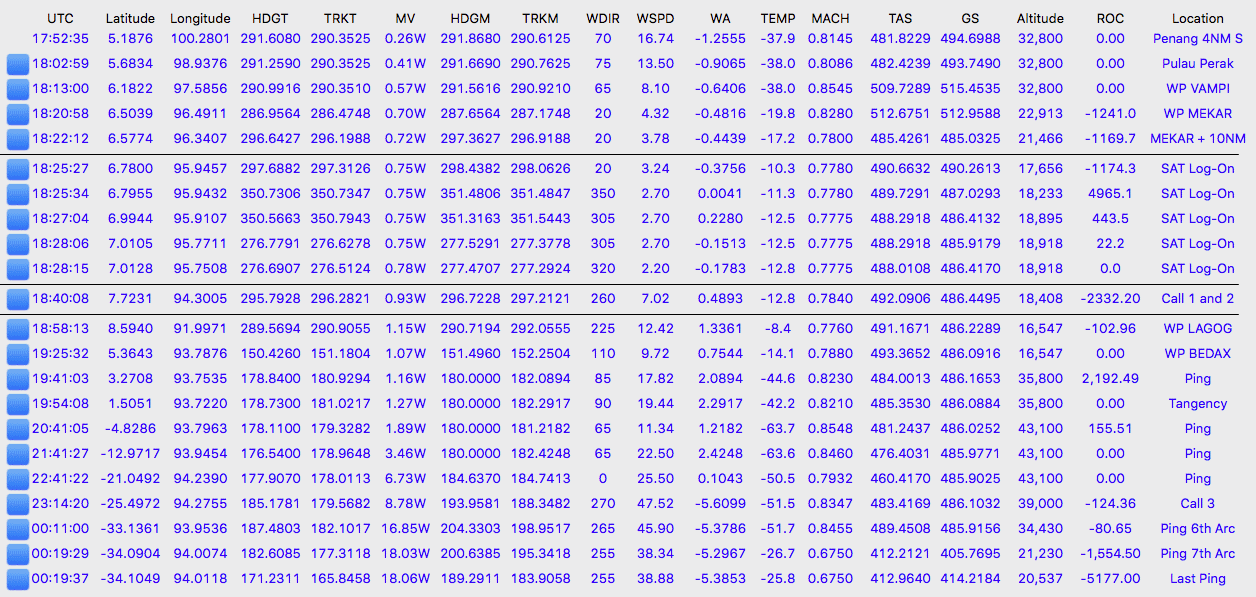

BTO and BFO data 
The BTO and BFO data show essentially a perfect fit for a flight path from VOCX to YPCC as above.

At each point the BTO error and the BFO error is zero (although I still believe the approach used in the McMurdo paper is better, where BTO and BFO errors are constrained only to certain limits).

In contrast to the McMurdo flight route, this option allows changes after VOCX in both heading and Mach speed. 

The McMurdo flight route, with a constant Great Circle path and constant Mach, does not require an active pilot after VOCX, whereas this hypothesis requires an active pilot until the end.


Kate Tee 
The flight path from VOCX to YPCC passes close to the possible sighting made by Kate Tee.

If there was no loiter at VOCX, the timing of the Kate Tee sighting also fits.

I estimate MH370 was at VOCX at 19:02:33 UTC and would take 22 minutes 36 seconds to reach the area around the Kate Tee sighting at 6.63N 94.44E.

This would give an arrival time in the area where Kate Tee made her sighting at about 19:25:09 UTC.

From the GPS log of Kate Tee’s boat, the time of the MH370 sighting was placed at around 19:25:20 UTC.


Drift Analysis 
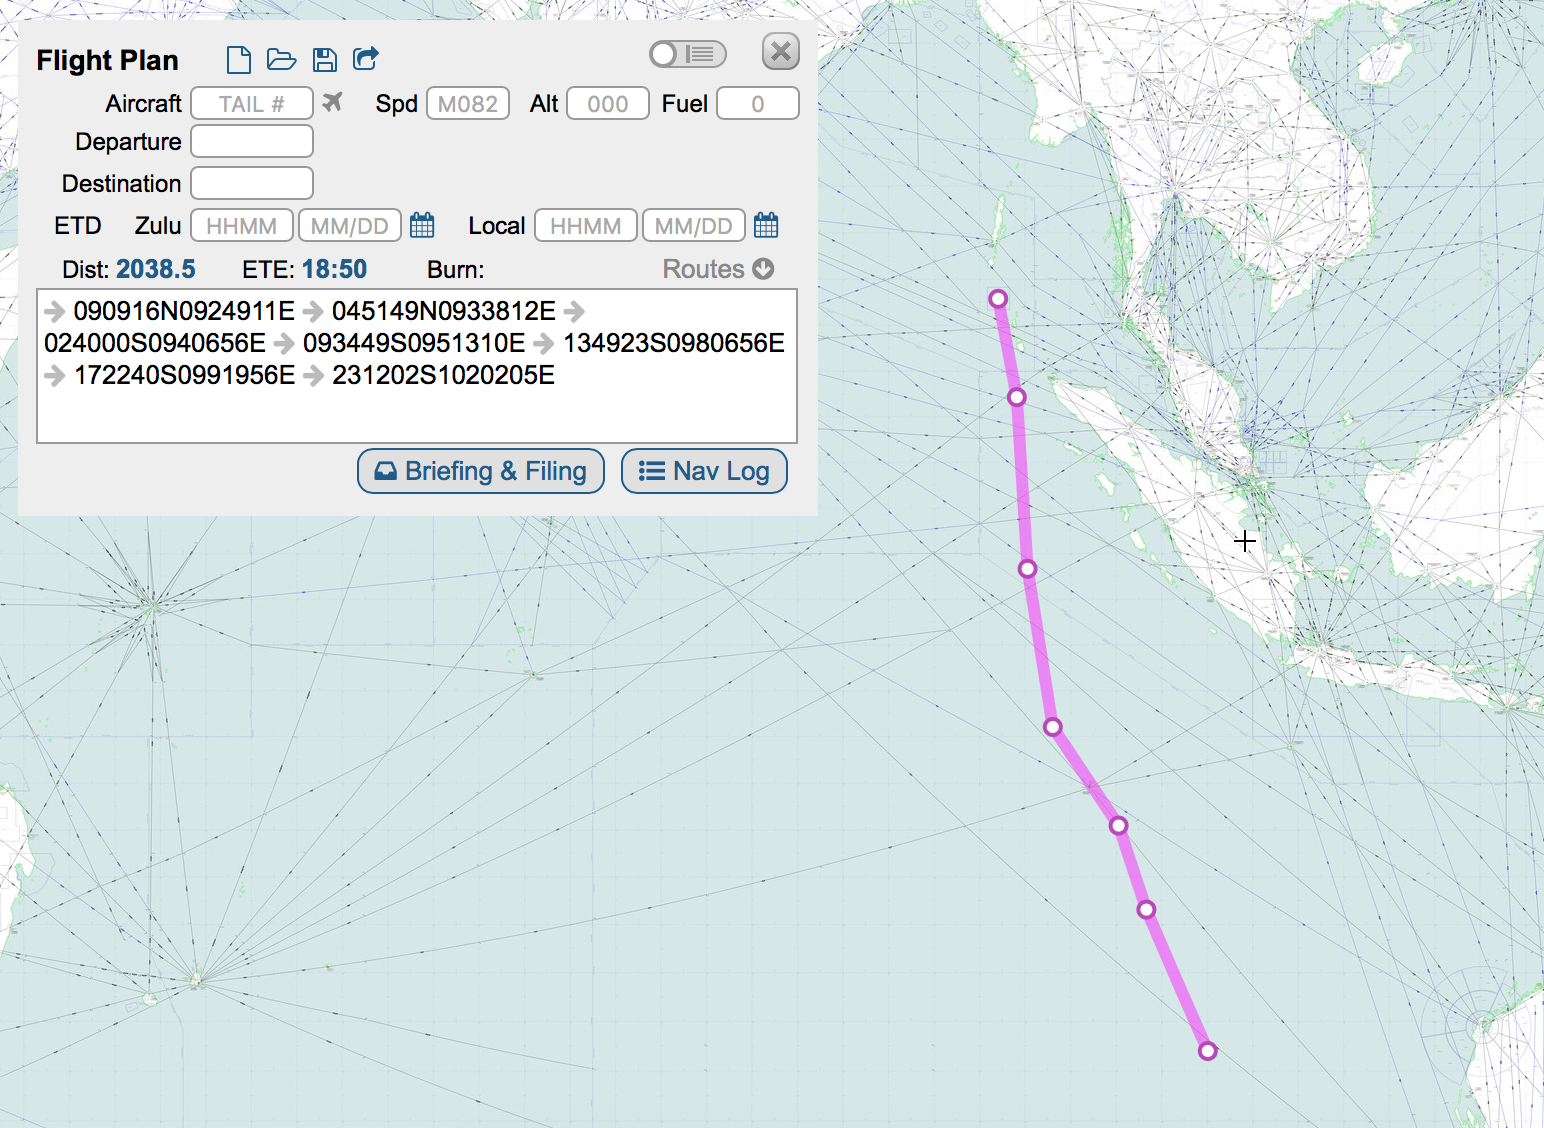
The MH370 end point following the flight path from VOCX, past YPCC until fuel exhaustion is located near 23°S 102°E.

Although there have been several drift analyses reported with a range of results, their common factor is that the floating debris started from a point much further north than the current search area.


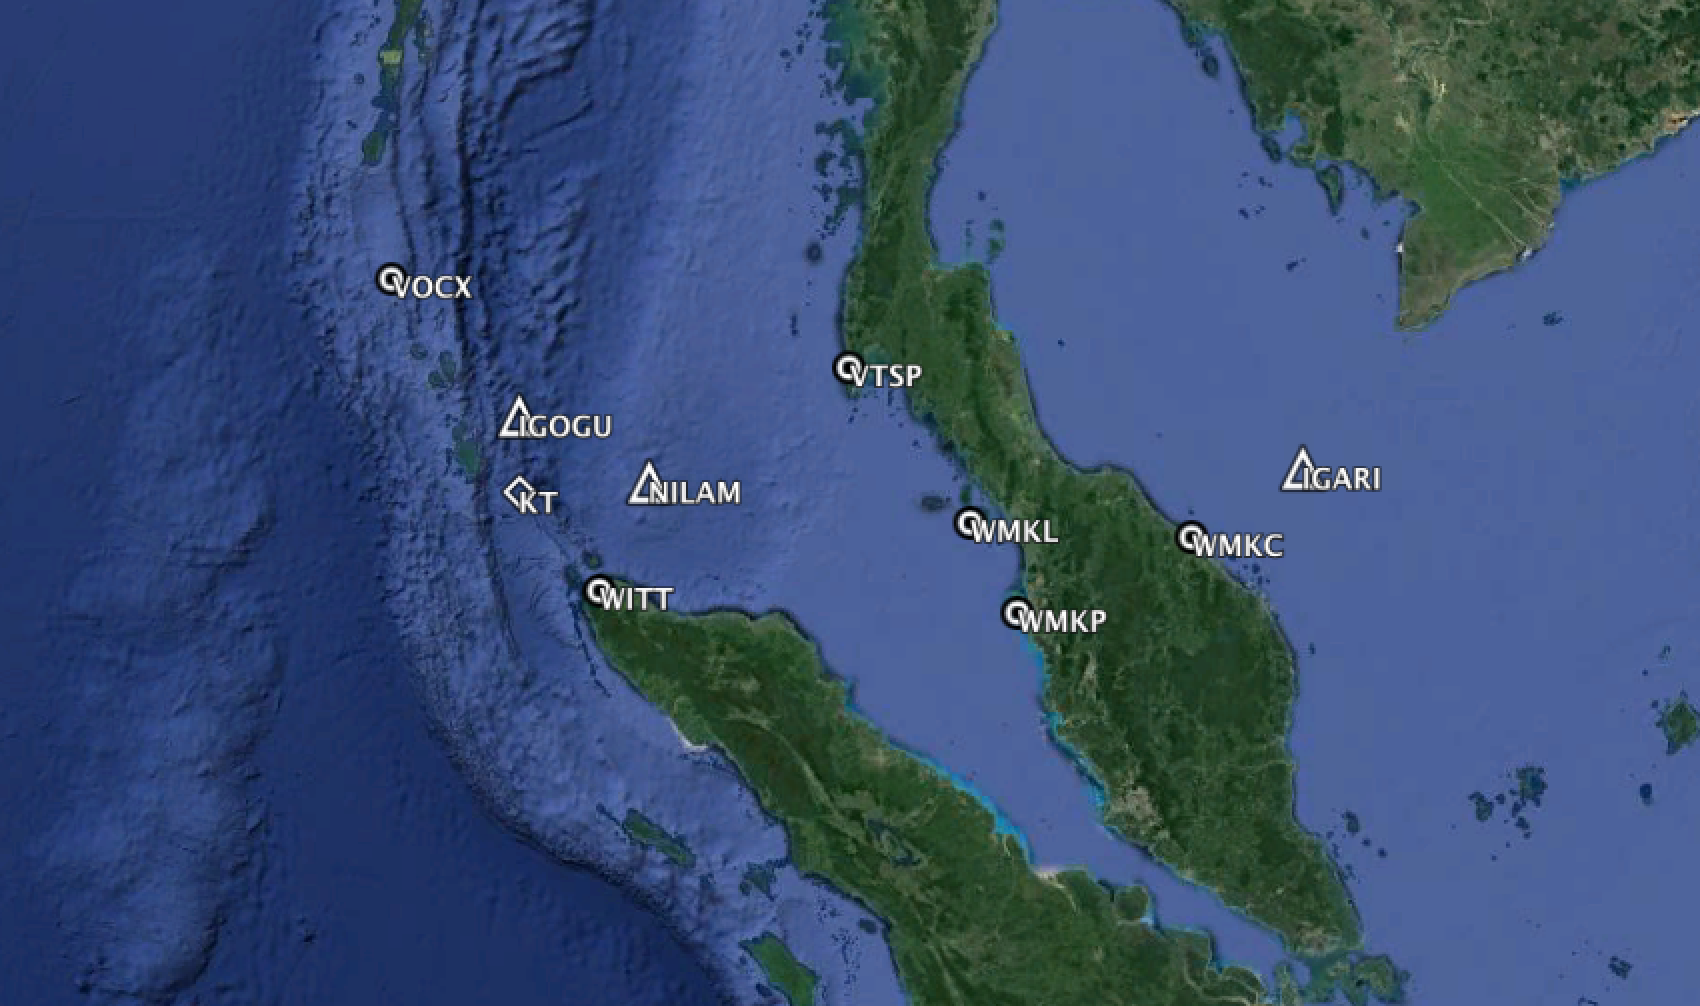
Table, Map and Flight Route 
The table below indicates the relevant data, the key points mentioned and the subsequent flight route. The map following it indicates the locations of the points mentioned above. After that is a map showing the flight route southwards that results from the modelling described above. 

diversion-airports

diversion-airports-map


mh370-flight-path-model-fmc-vocx


Aerial Search 
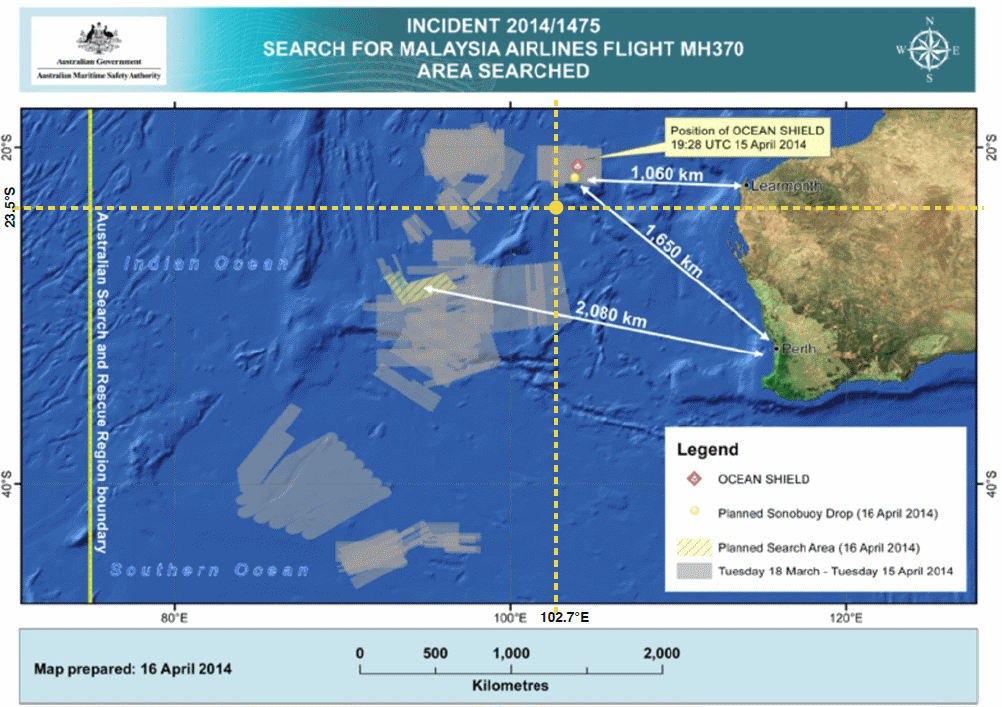
The map below was published by AMSA on 16th April 2014 and shows the cumulative aerial search area for MH370. To that map has been added the yellow dashed lines, indicating the crash location suggested here. As can be seen, there is a large gap around the hypothesised MH370 end point of 23.5°S 102.7°E on the 7th Arc.
amsa_map


Global Drifter Program Buoy 101703 
The Global Drifter Program maintains a global array of 1,250 buoys covering all the oceans of the world. These buoys or drifters have a drogue or sea anchor, which ensures that the buoy flows with the currents.

Data are sent from the buoy via satellite every 6 hours, giving position, speed, sea temperature, etc.

Buoy 101703 was launched in the Indian Ocean on 12th July 2013 at 29.011°S 105.076°E, off the coast of Australia (and marked with a bright green dot on the map below). The path of the drifter buoy is marked with dots (white means slowest speed, red means fastest speed).
gdp-buoy-101703-complete


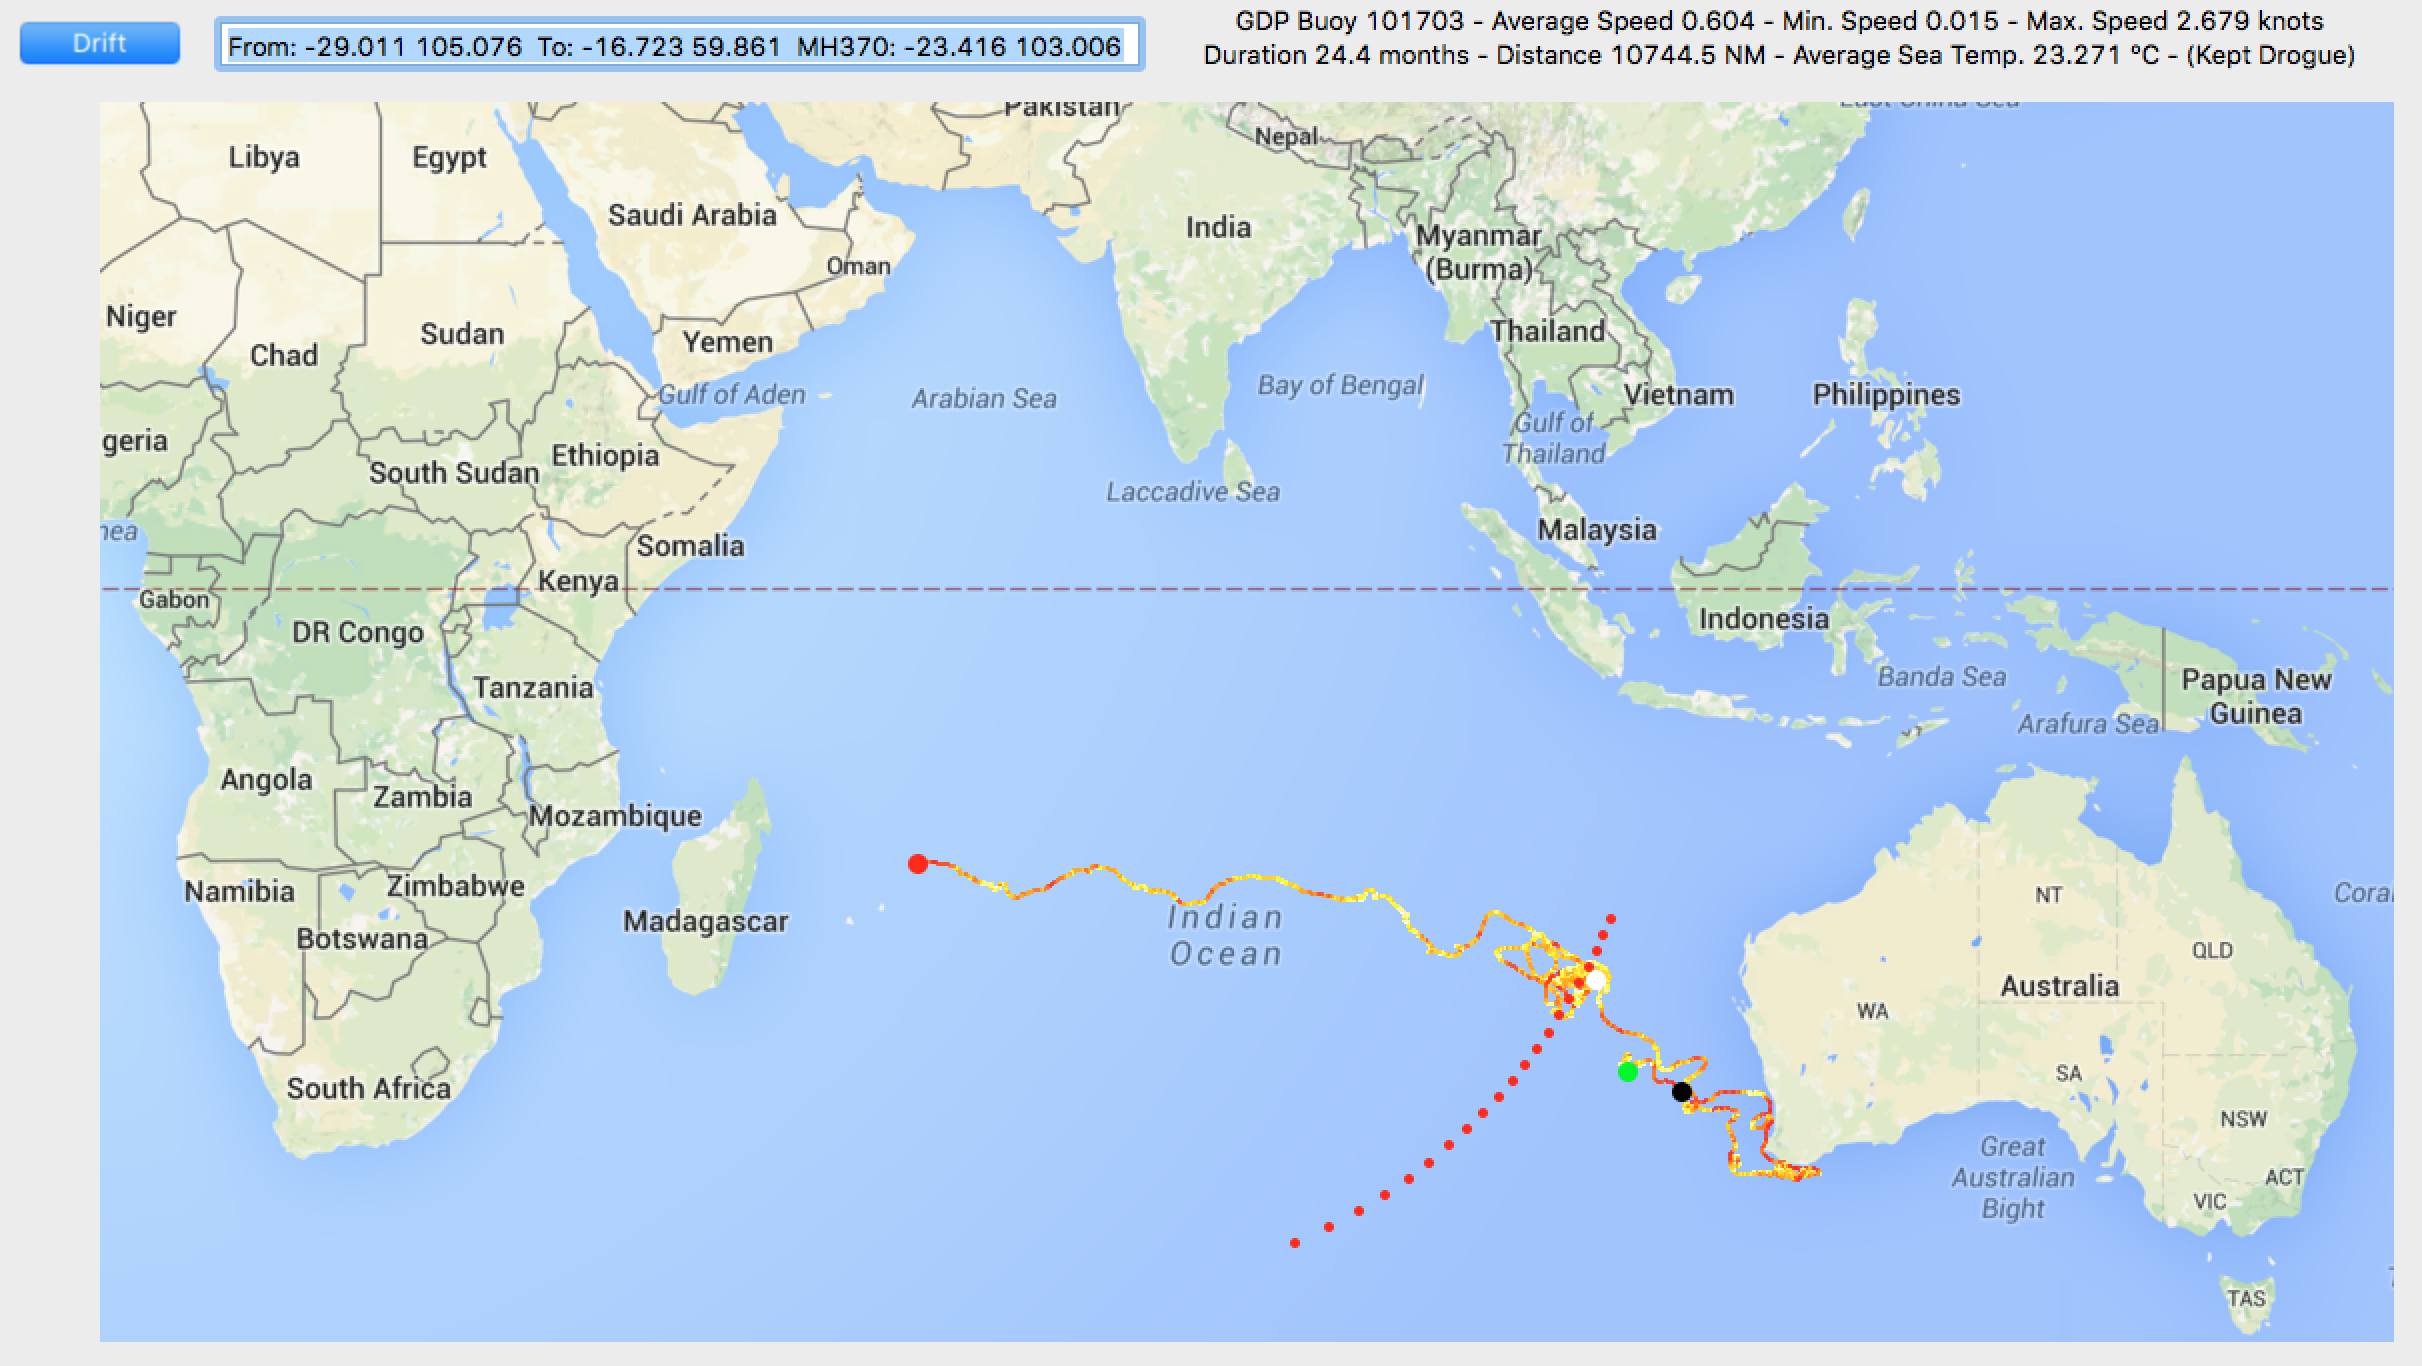
This buoy is of particular interest because it passed the 7th Arc close to the hypothesised MH370 end point of 23.5°S 102.7°E on 8th March 2014.

On 8th March 2014 at 00:00 UTC, buoy 101703 was at 23.416°S 103.006°E (marked with a large white dot on the map above).

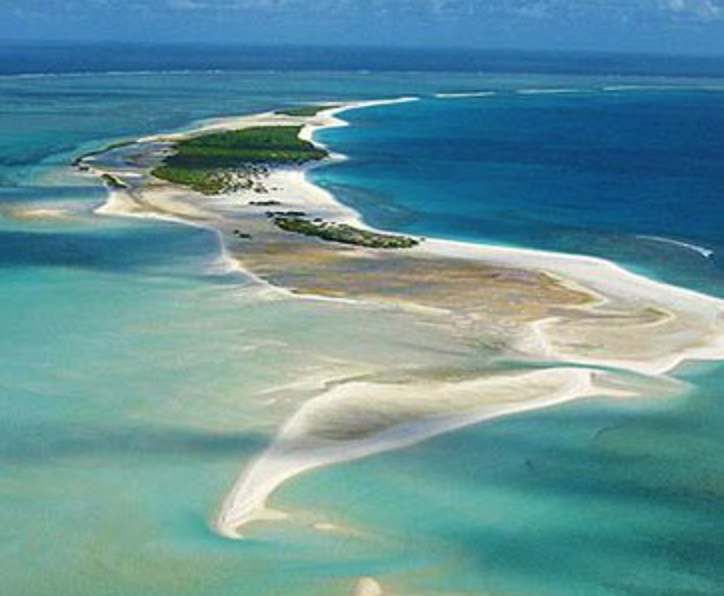
The buoy ended on 23rd July 2015 at 16.730°S 59.830°E in the Cargadas Carajas Shoals (pictured below) 232 NM north east of Mauritius (marked with a large red dot on the map above).
cargados-carajos-shoals

Other buoys in the area of the 7th Arc on 8th March 2014 show a similar pattern.

The average speed of buoy 101703 was 0.604 knots and the maximum speed reached was 2.679 knots (marked with a large black dot on the map above).

The overall distance travelled by this buoy is similar to that covered by the MH370 flaperon, which drifted in the same time frame to arrive in Réunion on or before 29th July 2015, 6 days after buoy 101703 arrived at its end point.


It is evident that the buoy 101703 spent a lot of time around the 7th Arc from 8th March 2014 onwards. Other buoys made a more direct route across the Indian Ocean.

In fact it was not until 22nd November 2014 that this buoy left the area of the 7th Arc to begin its journey to the Cargadas Carajas Shoals.

If MH370 ended at 23.5°S on the 7th Arc, then it is possible that floating debris stayed in that area for several months.


Global Drifter Program Buoy 101703 from the 7th Arc 
When the buoy finally started its journey from the 7th Arc, it took 8 months to reach its destination 3,390 NM away, at an average speed of 0.579 knots and a maximum speed of 1.55 knots near the end (see map below).

The buoy kept its drogue for the whole journey and therefore provides reliable drift data.
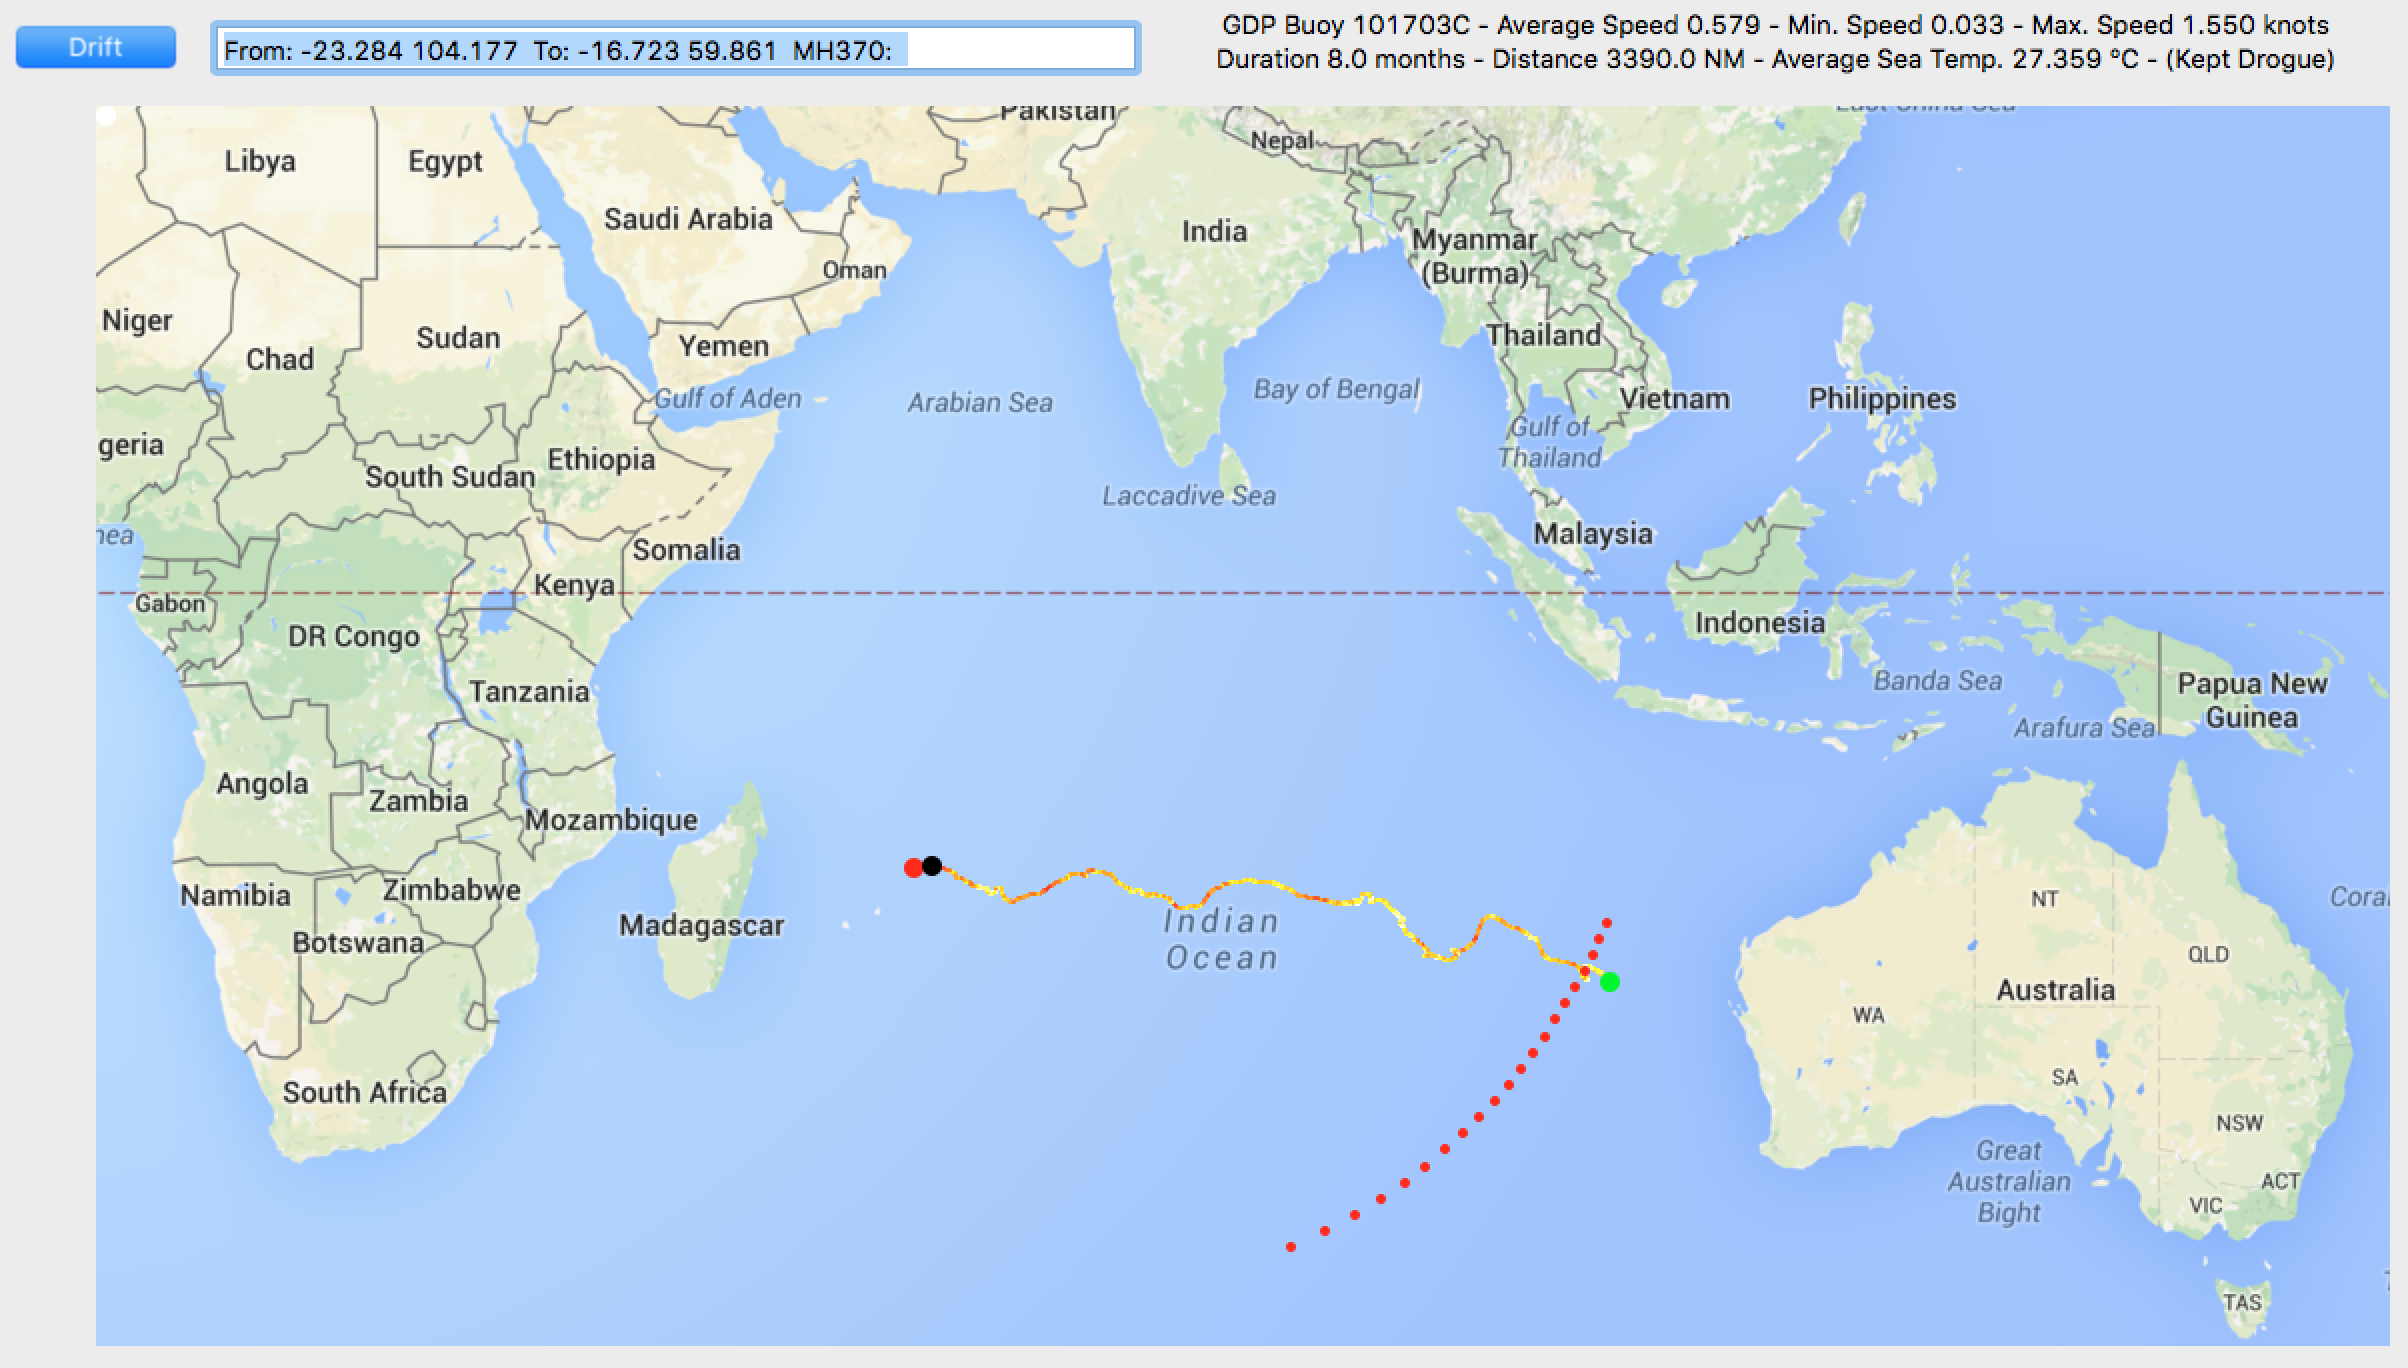
gdp-buoy-101703-partial
Goose Barnacles 
The flaperon found in Réunion carried a significant population of goose barnacles. 

The average sea temperature for the journey of the buoy 101703 across the Indian Ocean was 27.359°C. 

Goose barnacles (Lepas anatifera) are most abundant in tropical and subtropical waters where sea temperatures exceed 18-20 ºC. (Castro, et al., 1999; Nobanis, 2008; Patel, 1959). 

Approximately 120 days after settlement these barnacles develop reproductive organs at temperatures between 10.2 to 18.4 ºC, but the reproductive development takes 30 days, if the surface temperature of the water is around 25 ºC. (Anderson, 1994; Cowles, 2005; “Goose barnacle (Lepas anatifera)”, 2010).

The warmer waters in the journey from 23.5°S would favour the colonisation and reproduction of goose barnacles, therefore indicating a likelihood of the flaperon spending more time at such latitudes. 


Global Drifter Program Buoy 101665 
As mentioned above, other buoys in the area of the 7th Arc on 8th March 2014 show a similar pattern.

For example, Buoy 101655 was launched in the Indian Ocean on 13th July 2013 at 27.360°S 104.753°E off the coast of Australia (marked with a green dot on the map below).

gdp-buoy-101655


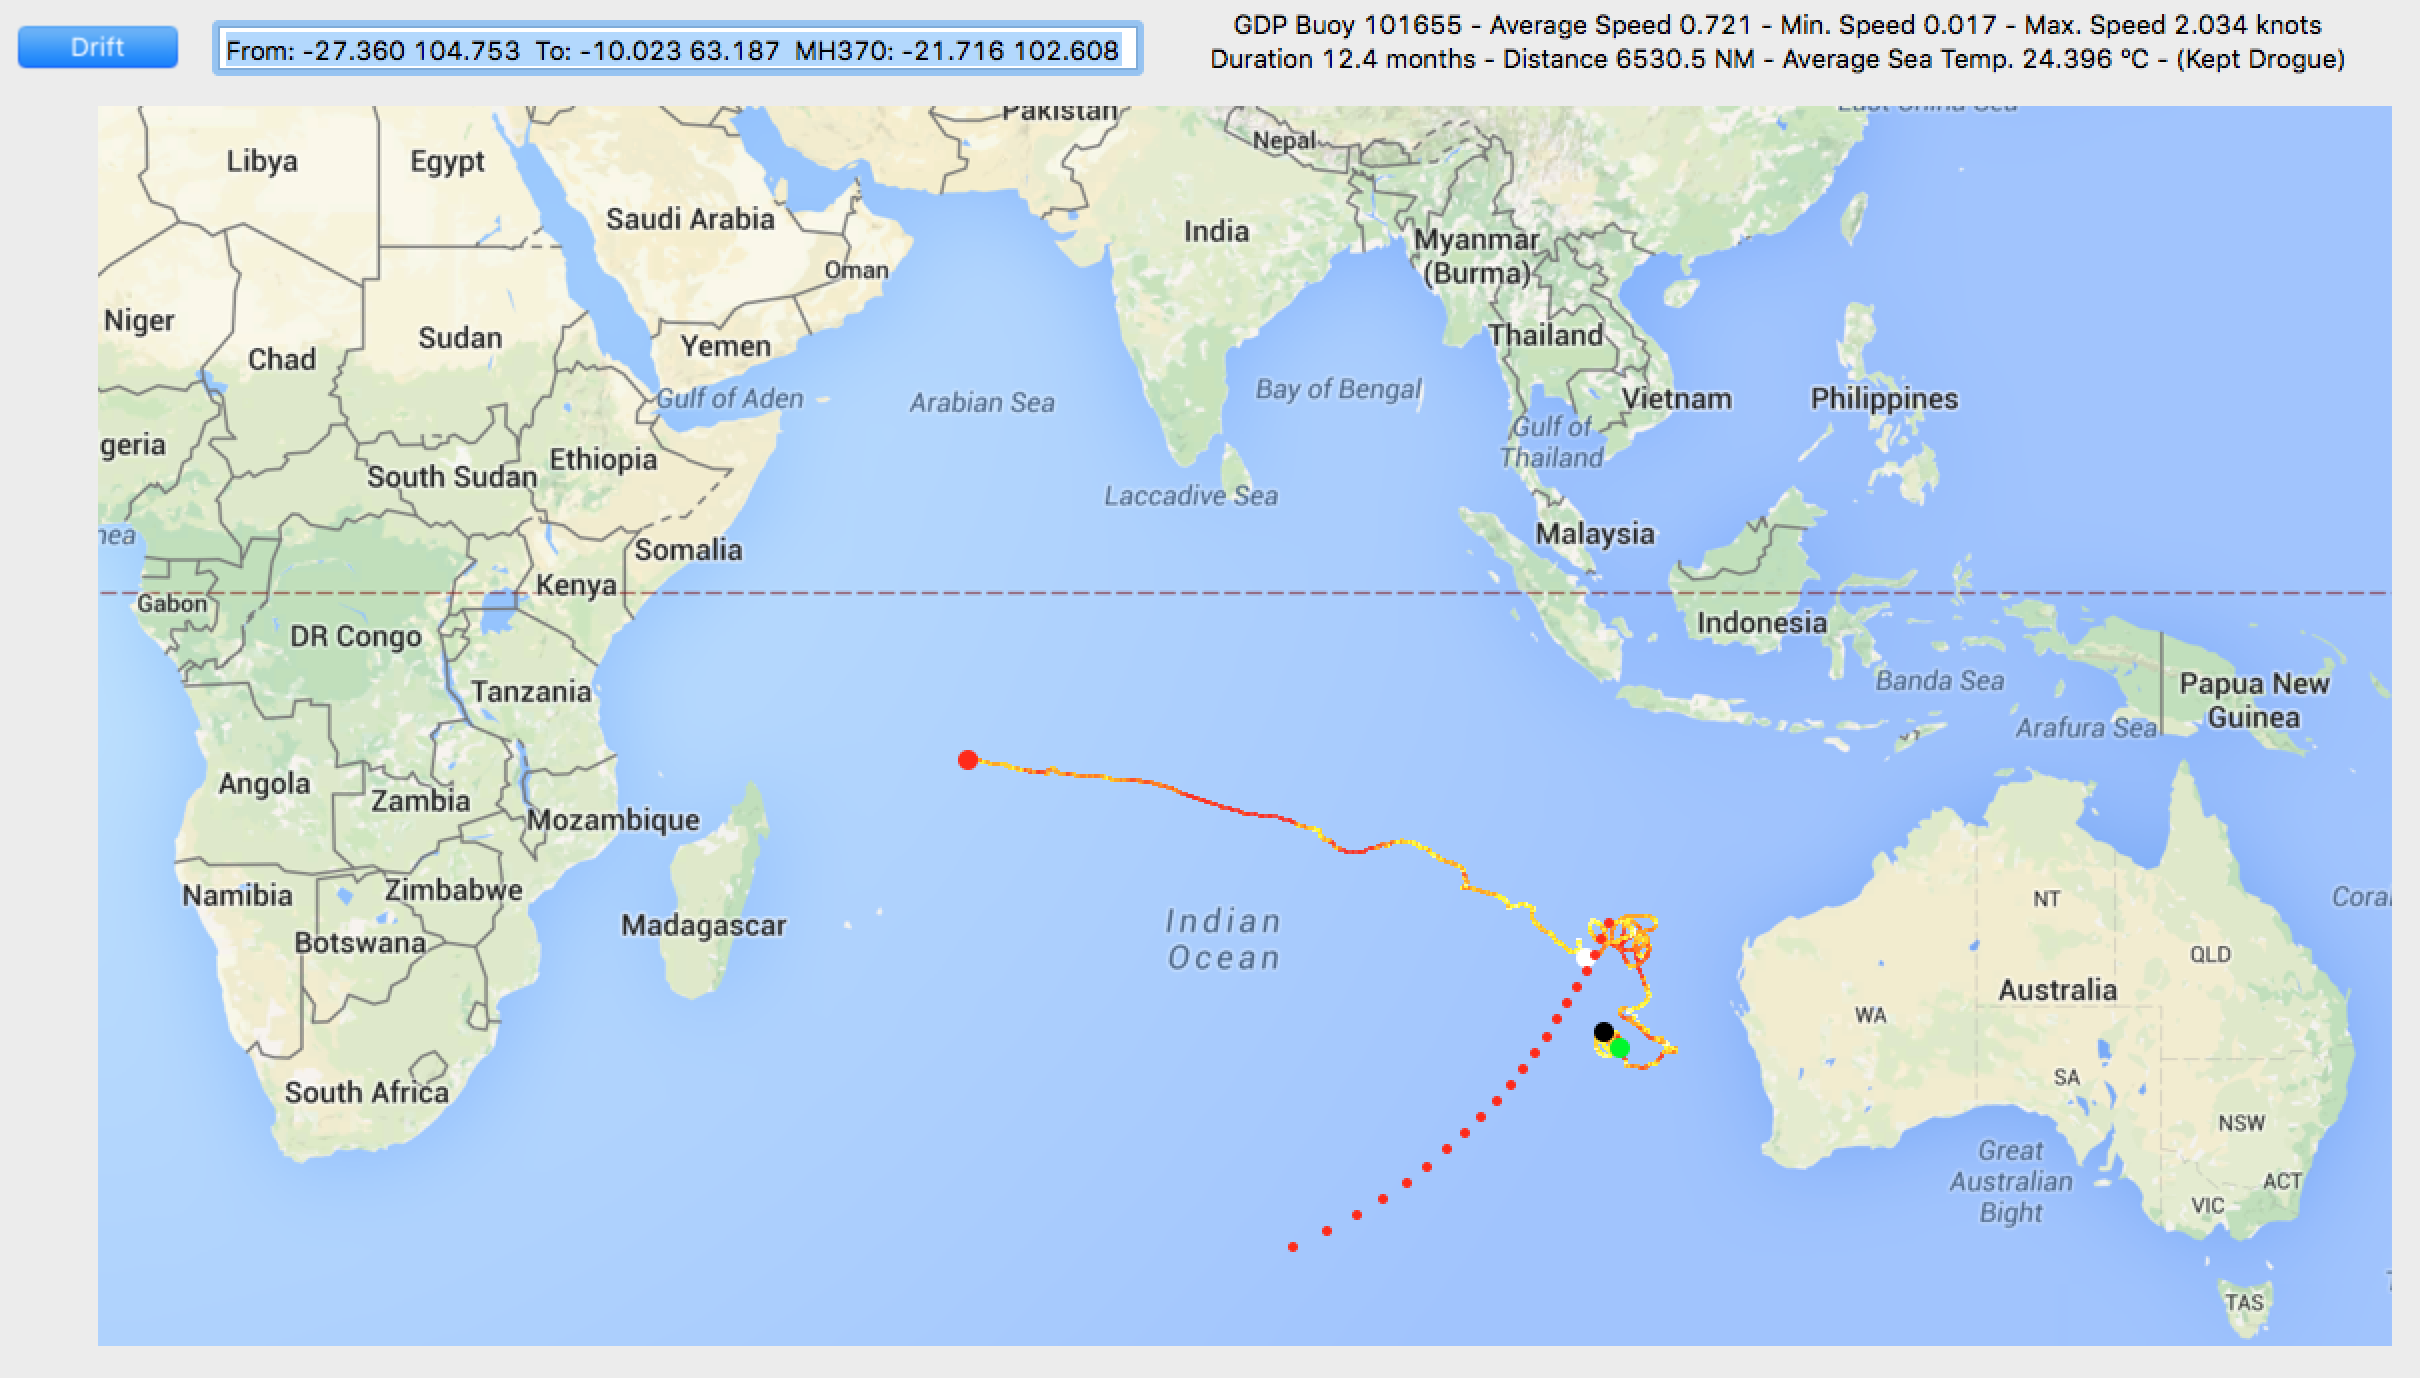
This buoy passed near the 7th Arc at 21.716°S 102.608°E on 8th March 2014 (marked with a large white dot on the map above).

The buoy ended, after a 4.6 month journey from the 7th Arc, on 26th July 2014 at 10.023°S 63.187°E in the Mascarene Plateau between Mauritius and the Seychelles (marked with a large red dot on the map above).

Conclusion 
The intent of this post has simply been to outline a possible chain of events that lead to a crash into the ocean by MH370 at a location near 23°S 102°E. Further, the evidence of the floating debris found in the western Indian Ocean, plus the barnacle growth found on some of those items, is consistent with a crash at such a low latitude and close to the 7th arc.


Why the 60 Minutes TV programme was wrong

Why the 60 Minutes TV programme was wrong

Michael Exner
August 11, 2016


The 60 Minutes episode concerning the loss of MH370 as broadcast recently on Channel 9 in Australia contained numerous errors. In particular the logic behind Larry Vance’s theory (that the damage to the flaperon and flap from the aircraft demonstrates that a controlled ditch must have occurred) is fatally flawed.

Vance looked at the flaperon photographs and within seconds, according to his own words, concluded that the leading and trailing edge damage patterns could only be explained by a water landing with the flaps deployed. Vance makes no attempt to consider all the other evidence that has been assembled. He then reasons that at least one engine must have been running at touchdown in order to provide the electrical and hydraulic power which he admits would be required for the flaps to have been be deployed for that touchdown.

This leads him to the further conclusion that all the well-documented evidence showing that fuel exhaustion occurred at high altitude circa 00:17:30 (UTC) must be wrong. In essence, Vance argues that his visual inspection of a few flaperon photos is all he needs to impeach the extensive body of evidence and analysis supporting the belief that fuel exhaustion occurred at about 00:17:30, followed by an APU power-up at about 00:18:30, this being followed by the AES/SDU logon at 00:19:29 and subsequent high speed crash circa 00:21 UTC.

Vance obviously has no understanding of satellite communications systems and the burst frequency offset (BFO) data analysis. He has not even tried to learn what those data can tell us from the SATCOM experts who have studied the information in considerable detail. He simply dismisses everything he does not have the background and experience to understand, and jumps to an alternative conclusion. This is very unprofessional.

The ATSB, Inmarsat, and Boeing have acknowledged from the beginning that the 00:19:29 BFO value indicates a descent rate of about 5,000 ft/min, and in recent interviews and statements, the ATSB has finally gone further and definitively stated that the 00:19:37 BFO value indicates the plane was descending at that time at a speed of 12,000 to 20,000 ft/min, exactly what the Independent Group has consistently argued for the last two years and more.

If one puts all the available evidence on the table, instead of only a few flaperon photos, a very different interpretation of the flaperon damage pattern comes to light. We know with high confidence from the Inmarsat data and fuel consumption analysis that MH370 was at high altitude and flying at over 400 knots when fuel exhaustion occurred circa 00:17:30. The flaps could not have been extended at 400 knots before fuel exhaustion, and following fuel exhaustion, they could not have been extended at any altitude or airspeed. These are facts that Vance ignores. Thus, the trailing edge damage to the flaperon could not possibly have been caused by a flaps-down water landing.

After the final ping at 00:19:37, the fact that there was no signal indicating an IFE logon at  about 00:21:07 is consistent with impact at very high speed sometime between those two times. The debris found recently by Blaine Gibson and several other private citizens is clearly consistent with the above information that indicates a high speed impact.

Given the information cited above, it is much more likely that the flaperon separated in-flight circa 00:20 due to aeroelastic flutter as the aircraft was rapidly descending. The part-flap discovered in Tanzania may also have separated prior to impact due to such flutter. These large pieces of debris were apparently not attached to the plane at the time of the main impact because in that circumstance they would have suffered far more extensive damage. Indeed, from the evidence of the much smaller pieces of debris so far recovered from both the interior and exterior of the plane, it is difficult to imagine how the flaperon and flap segment could have survived the main impact without completely disintegrating (i.e. being shattered into rather smaller pieces).

The evidence that Vance ignores, when combined with the flaperon photos, demonstrate that his statement that the aircraft undoubtedly came down in a controlled ditch is simply wrong. Vance’s statements on 60 Minutes have caused great harm to the search for the truth about what happened to MH370. His continued attempts to justify his definitive statements only exacerbate the situation.


Where is MH370 and how will it be found?

Where is MH370 and how will it be found?

Richard Godfrey
10th July 2016


Introduction
Twenty-eight months after the disappearance of MH370, we still do not know where the aircraft crashed.

The ATSB has led an underwater search and is reaching the end of their allocated funds of $180M, used to search 120,000 square kilometres of ocean bottom.

The Government Ministers of Malaysia, China and Australia are meeting in Kuala Lumpur on 19th July 2016, and it is anticipated that they will announce the end of the underwater search for the wreckage of MH370.

Since 29th July 2015, at least fifteen internal and external aircraft parts have apparently been found, washed ashore in 11 locations on the coasts of Tanzania, Mozambique and South Africa and on the Indian Ocean islands of Rodrigues, Mauritius, Réunion and Madagascar. The majority have been confirmed as being from (or are regarded as highly likely to be from) MH370. Over 50 items of personal effects, suspected as being from the crash of MH370, have also been identified. 


Background
Investigators have collected information from many sources: primary radar detections, satellite pings, aircraft performance data, standard flight routes and waypoints, autopilot modes, autothrottle modes, fuel range, fuel endurance, weather, winds, air temperatures, magnetic variation tables, debris finds, ocean drift analyses, satellite imagery, airborne reconnaissance, hydrophone acoustics, the underwater search, etcetera. 

With all this information, why has MH370 not been found? 

The debris finds have resulted in a number of drift analyses being published, but there are large differences in the results. Critics validly point out any drift analysis is subject to many uncertainties (see this paper and also preceding papers posted on this website, and indeed elsewhere). 

There are even more satellite ping analyses that have been published, but there are also substantial differences between the results. Critics point out that although the BTO data has a ±10 km tolerance, the BFO data are proportionately worse, with a ±7 Hz tolerance. 

Inmarsat engineers, in their paper dated 4th September 2014, explained that while the BTO figures render the aircraft’s instantaneous distance from the satellite, the BFO data can be deciphered so as to get the aircraft’s speed and track relative to the satellite, subject to various assumptions. Without the BFO data, one does not know which way MH370 was heading; the BFO information indicates a path southwards across the Indian Ocean. 

The Inmarsat engineers pointed out that a ±7 Hz BFO tolerance corresponds to a +/- 9° latitude uncertainty or ±28° heading uncertainty. However, they appear to have ignored or neglected the fact that the BFO is not only related to an aircraft’s horizontal velocity but also to an aircraft’s vertical speed (or rate of climb, ROC). With three fundamental variables — ground speed, heading/track and ROC — rather than just two, fitting the BFO data to a flight path analysis is made more difficult, because you can easily adjust the ROC to fit against many different ground speeds or tracks. 

If one sets aside, for the time being, the drift analyses and the satellite BFO data, what are you left with? 

The major variable that determines the latitude of the end point is the ground speed. Not only the thrust setting and autothrottle mode are important in determining the ground speed, but also the weather data (including wind directions and speed);  the air temperature will additionally impact both air and ground speeds.

Another key variable is the assumed altitude. The air speed, air temperature, radar information, fuel range and endurance and aircraft performance data all provide constraints on the range of possible altitudes. 

A third key factor to consider is the autopilot and autothrottle mode. The air speed, radar data, fuel range and endurance, track/heading, weather data and aircraft performance data all provide clues as to the autopilot modes that were engaged. 

A fourth key factor is the time and position adopted for the final major turn (FMT): was this immediately after the last reported primary radar position at 18:22:12 UTC, or was there an extended excursion northwest, over the Andaman Islands or elsewhere? 

Finally there are uncertainties surrounding loiters, lateral path offsets, circling, aborted emergency landing(s), step climbs, and so on. Many previous posts  on this website have involved discussions of such hypothetical manoeuvres. 

In this paper I will try to determine the range of feasible MH370 end point latitudes along the 7th ping arc without using either (a) The oceanic drift modelling of floating debris; or (b) The BFO data. Herein I impose minimum and maximum speeds, altitudes, bearings, FMT position, loiters, etc., which constrain the derived end points for MH370. Obviously, if the drift analyses and the flight paths making use of the BFO data also indicate much-the-same latitude range, then a consistent picture is achieved and so one has added confidence that the derived latitude range is correct. 

In this paper, then, I ask the following question (and also try to answer it): Can one find MH370 (i.e. indicate a latitude range near the 7th arc) without having to rely on uncertain drift analyses or imprecise BFO data? 


Ground Speed versus Latitude
The Malaysian Preliminary Report (in April 2014) stated that “The tracking by the Military continued as the radar return was observed to be heading towards waypoint MEKAR, a waypoint on Airways N571 when it disappeared abruptly at 18:22:12 UTC [0222:12 MYT], 10 nautical miles (NM) after waypoint MEKAR.” 

If the aircraft turned south immediately after it disappeared from the military radar, then at an average ground speed of 300 knots the end point on the 7th Arc would be around 23°S, and at an average ground speed of 500 knots, the end point would be around 43°S (see Table 1 below). The ground speed might have been faster than 500 knots or slower than 300 knots, but these two points are 3,452 km apart and already represent an extremely large search area (if one were searching say 30 NM each side of the 7th arc). If we could put a much tighter range on the ground speed from the available information, then the search area would be much reduced. Of course, we also have to know when and where the aircraft finally turned south (the FMT); this might not have been at the earliest possible moment but could have been much later.

RG_Table1

Table 1: Range of latitudes reached on the 7th arc for different ground speeds based on a FMT just after the final radar detection. 


Ground Speed from Radar Data
The Australian Defence Science and Technology Group (DSTG) report states that “The radar data contains regular estimates of latitude, longitude and altitude at 10 second intervals from 16:42:27 UTC to 18:01:49 UTC.” Unfortunately, this data set has not been publicly released, but the DSTG report includes a graph of ground speed derived from the primary radar data having applied a Kalman filter, which indicates a ground speed of 521 knots at 18:01:40 UTC, slowly tapering to 509 knots at 18:22:12 UTC (the final radar detection time), whilst over the Malacca Strait. 

The Malaysian Preliminary Report gives a military radar return at 17:39:59 UTC, whilst still over Malaysia, which indicates a ground speed of 529 knots at an altitude of 32,800 feet. This is not inconsistent with the DSTG graph.

Bill Holland of the Independent Group (IG) analysed the radar trace shown by the Malaysian authorities to the MH370 Next-of-Kin (NoK) in Beijing in late March 2014. This trace shows MH370 flying via waypoints VAMPI and MEKAR. From his timeline analysis, Bill found the ground speed to vary between 495 knots to 515 knots and back down to 485 knots.

RG_Fig1

Figure 1: Bill Holland’s annotated trace of primary radar positions of MH370.

In summary, we can say that the range of ground speeds of MH370 when flying above the Malacca Strait, based on radar tracking data, was between 485 and 515 knots, as indicated in Table 2 below. 

RG_Table2
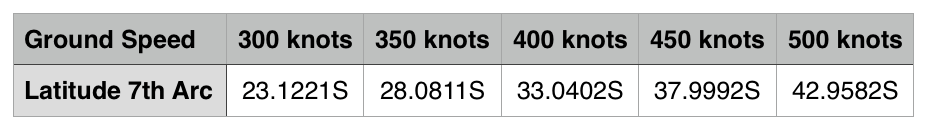
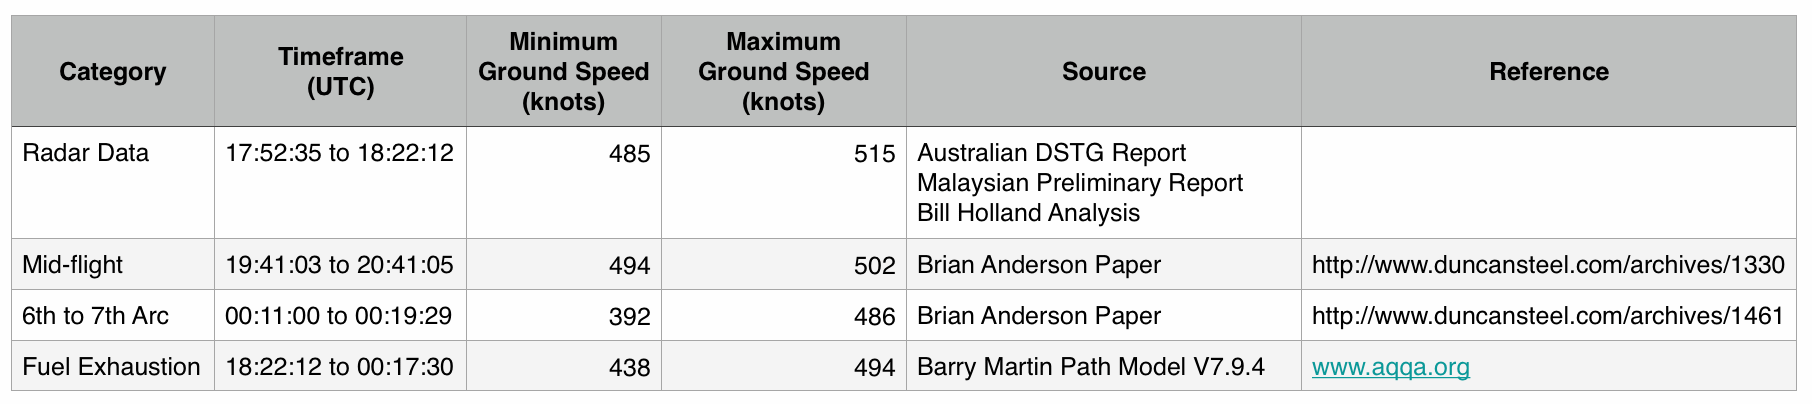
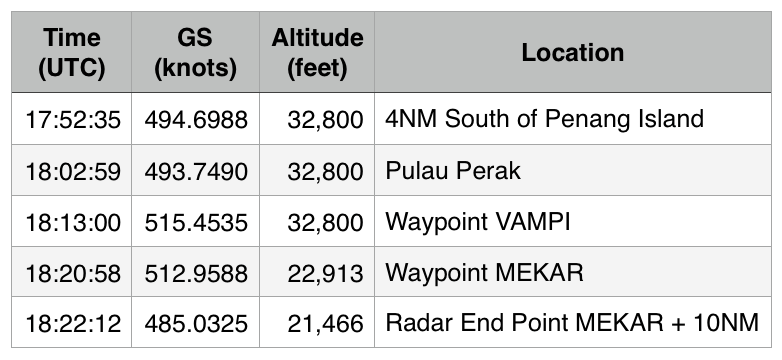
Table 2 : Ground speeds and minimum altitudes of MH370, based on primary radar information. 


Ground Speed in Mid-flight
Brian Anderson (IG) published a paper entitled “Deducing the Mid-Flight Speed of MH370”, dated 20th March 2015.  

In this paper was presented a preliminary calculation of the average ground speed of 476 knots for the mid-flight phase between 19:41:03 and 20:41:05 UTC. Brian used planar geometry at the tangent point, as MH370 passed the closest point to the satellite. 

Brian has later recalculated the average ground speed using spherical geometry, arriving at a figure of 494 knots. 

Brian needed to make certain assumptions concerning the altitude of the aircraft and the ping ring distances.

Revisiting Brian’s planar and spherical calculations, employing a range of conceivable altitudes between 25,000 feet and 45,000 feet and using the best satellite data to calculate the ping ring locations, results in a range of ground speeds between 494 knots and 502 knots. 

In summary, we can say that, subject to various necessary assumptions, the range of possible ground speeds in the mid-flight phase was from 494 knots to 502 knots.


Ground Speed between the 6th and 7th Arcs
Brian Anderson also published a paper entitled “The Last 15 Minutes of Flight of MH370”, dated 24th April 2015. This concerned the end-phase of the powered flight of MH370. 

In this paper Brian analysed the available fuel, engine and simulator information, the timings of the right engine fuel exhaustion (first), followed by the left engine fuel exhaustion (second), and the resultant air speed and ground speed profiles.

Brian’s calculation indicate that following the first engine failure there was a reduction in air speed (an ongoing deceleration) by around 19 knots per minute.

At the time of writing the above paper, Brian concluded that only with ground speeds greater than about 440 knots at 00:11 UTC (i.e. the 6th ping arc) is it possible subsequently to reach the 7th arc, even if that arc were at sea level.

In later discussions with Brian, the minimum ground speed at 00:11 UTC was revised to 392 knots, following the ATSB publishing updates regarding the events in the last 15 minutes of flight. 

Brian analysed whether the aircraft continued to fly in a straight line or whether it banked left or right. He discussed various feasible scenarios, concluding that most likely a left turn developed following the second engine flame out (fuel exhaustion). 

I have now revisited Brian’s calculations for positions defined by different latitudes along the 7th arc between 20°S and 40°S; different adopted ground speeds at 00:11 UTC (6th arc); different altitudes at that time; and for different tracks. The best-fit ground speed at the 6th arc was found to be 486 knots, from the perspective of requiring that  the aircraft actually reached the 7th arc at 00:19:29 UTC (as is the case in reality). 

In summary, we can say that the range of feasible ground speeds at the 6th Arc ranges from 392 to 486 knots.


Ground Speed from Fuel Data
Mike Exner (IG) analysed the information regarding fuel availability and concluded in his fuel burn analysis dated 25th April 2015 that the right engine flame-out occurred at 00:10:54 UTC, followed by the Left Engine flame-out at 00:15:49 UTC. 

The ATSB interpretation initially aligned with Mike’s analysis but subsequently revised its evaluation of the likely left engine flame-out time to be near 00:17:30 UTC, with the right engine flame-out occurring up to 15 minutes beforehand (thus at some time after 00:02:30 UTC). 

Barry Martin (IG) included in his flight path model version 7.9.4 (dated 3rd March 2015) a fuel consumption analysis including the Rolls Royce Trent 892 fuel model (at flight levels 350, 370, 390, and 410) for both constant Mach and also Long Range Cruise (LRC) modes: see http://www.aqqa.org 

Considering the alternative fuel exhaustion times given above and based on a starting point at 18:22:12 UTC:

(1) Using Barry’s flight model in the LRC mode, a fuel exhaustion point would be reached at 00:15:45 UTC after travelling 2,897 NM (5,365 km), if an altitude of 39,000 feet is assumed. 

(2) Using Barry’s flight model in the LRC mode, a fuel exhaustion point would be reached at 00:17:15 UTC after 2,885 NM (5,343 km), if an altitude of 41,000 feet is used. 

For a turn south occurring at the final radar point at 18:22:12 UTC, the implied average ground speeds would be 491.6 and 487.5 knots respectively. 

However, the LRC autothrottle mode includes a speed profile:

(1) At 39,000 feet, this LRC mode shows a decreasing speed profile from 479.0 knots to 438.4 knots.

(2) At 41,000 feet, this LRC mode shows an increasing speed profile from 478.7 knots to 494.1 knots.

In summary, we can say that the range of ground speeds fitting with fuel exhaustion at the perceived range of times lies from 438 knots to 494 knots.


Ground Speed Summary
In summary there is a range of Ground Speeds between 392 knots and 515 knots, starting faster and possibly ending a bit slower, which fit the available information (so long as we exclude all consideration of the BFO data and also the floating debris drift modelling). See Table 3 below.

RG_Table3
Table 3: Summary of evaluations of possible ground speeds, and information sources. 

The so called ‘low-and-slow’ scenario does not fit the available information, the best fit being from a ‘high-and-fast’ scenario. 

Based on assuming an early FMT at 18:22:12 UTC, this result would favour latitudes ranging from 35°S to 43°S, rather than latitudes further north along the 7th arc.

The next key question that needs to be addressed, then, is this: Where did the FMT (final major turn southwards) take place? Was it immediately after the final primary radar detection point at 18:22:12 UTC, or did MH370 continue along standard flight route N571 for some considerable time before turning, or was some other route taken?


The Location of the Final Major Turn
The final radar detection at 18:22:12 UTC is near 6.5774°N 96.3407°E. This is 3,571 km from the sub-satellite location of 1.5317°N 64.5335°E. 

The 2nd ping arc at 19:41:03 UTC indicates that at that time MH370 was 3,250.5 km from the sub-satellite location of 1.6400°N 64.5194°E.

Therefore, in this elapsed time of 78 minutes 51 seconds, MH370 moved 320.5 km (173.1 NM) closer to the sub-satellite point, indicating a speed component along the direction radial to that point of approximately 131.7 knots. Obviously, the path followed is not that simple; that is, the aircraft was not travelling radially towards the sub-satellite point, but rather at some oblique angle to that direction. 

If MH370 had continued along flight route N571 at the minimum speed observed in the Malacca Strait (485 knots: see earlier) then the aircraft would have reached 11.2640°N 86.6963°E by 19:41:03 UTC , which is only 2,671 km from the sub-satellite position at that time (the 2nd ping); this is 579.5 km too close to the sub-satellite point, and so the aircraft must have turned before then. 

From the primary radar trace, we know that MH370 appears to have overflown waypoints VAMPI and MEKAR on N571. If it continued on flight route N571 the next waypoint is IGOGU. At 485 knots (again, the minimum speed observed over the Malacca Strait), MH370 would reach waypoint IGOGU by 18:38:00, which is 3,376 km from the sub-satellite position of 1.5884°N 64.5293°E at that time. This is still 125.5 km short of the 19:41:03 ping ring, but with a little over an hour to go, this is not an issue. 

If MH370 continued further on flight route N571, the next waypoint is LAGOG. At 485 knots MH370 would reach waypoint LAGOG by 18:57:31, which is 3,138 km from the sub-satellite position of 1.6175°N 64.5265°E. This is 112.5 km inside the 19:41:03 ping ring, but there is still 43.5 minutes to go and the aircraft could turn back and easily reach the 19:41:03 ping ring in time.

At a ground speed of 485 knots the latest turning point on flight route N571 is 96 km/52 NM beyond waypoint LAGOG, if the aircraft were to be able to turn back and reach the 19:41:03 ping ring on time. However, the next waypoint (BIKEN, 227 NM from LAGOG) is not feasible, at this assumed ground speed.
By using the maximum calculated ground speed over the Malacca Strait (515 knots) rather than the minimum (485 knots), slightly different figures are arrived at, but the same general picture arises: if MH370 were following waypoints, then LAGOG is the last feasible waypoint on flight route N571: the latest possible turning point on N571 is waypoint LAGOG, or shortly afterwards. 


Autopilot Mode
According to the primary radar information (Figure 1 above), MH370 passed waypoints VAMPI and MEKAR and followed flight route N571 toward IGOGU and possibly LAGOG.

If we constrain the adopted flight path to waypoints, then the following question arises: Which waypoints fit the BTO data and the ping rings derived from the BTO data? 

Victor Iannello (IG) recently published a paper entitled “Possible Flight Path for MH370 Ending North of the Current Search Zone” dated 25th June 2016.  

Victor presented a hypothesis that MH370 continued on flight route N571 to waypoint LAGOG (as described above), and then turned back to waypoint BEDAX and finally turned south on a heading of 180°M (i.e. 180 degrees magnetic), with a slowly-reducing altitude. 

An autopilot Lateral Navigation (LNAV) mode using waypoints followed by the ‘Heading Select’ function is easy for a pilot to implement, and fits the BTO data.

Assuming the flight path scenario via waypoint LAGOG, and given the fuel analysis discussed above, the range of latitudes reached at fuel exhaustion range from 31.7°S to 34.9°S.

Victor calculated the latitude reached at fuel exhaustion to be near 31.5°S, which aligns with that fuel analysis.

In summary, we can say that a flight path via waypoint LAGOG and BEDAX fits the primary radar information, the likely autopilot mode, the BTO data, and the fuel analysis; and also, it happens, the BFO data, which has heretofore been excluded in this paper. 


Autothrottle Mode 
If the autopilot was engaged, was the autothrottle also engaged? 

Victor, in his paper,  assumed a thrust mode as follows: speed Mach 0.84, followed by 310 KIAS (Knots Indicated Air Speed) after descending past the cross-over altitude of 31,560 feet. 

The resulting ground speeds ranged from 504 knots at 20:41 UTC to 367 knots at 00:11 UTC. The upper limit fits with the discussion above, but the lower limit only fits when you take a descent to 11,824 feet into consideration; Victor required a gradually-descending path so as to fit the BFO data. 

An alternative scenario is a constant ground speed of 486 knots from 18:22:12 to 00:11:00 UTC, which fits both the fuel range and fuel endurance analysis; the latitude reached in this case is 34.0°S.

In summary, we can say that a flight path via waypoint LAGOG and BEDAX fits the radar information, the likely autopilot mode, a likely autothrottle mode, the BTO data, and the fuel analysis (plus the BFO data). 


Conclusion
Without using either the ocean drift analyses or the BFO data it is possible to describe a flight path that fits the radar, BTO, aircraft performance limits, flight routes, autopilot modes, autothrottle modes, fuel range, fuel endurance, weather, winds, air temperature and magnetic variation constraints. 

The range of latitudes indicated to be reached at fuel exhaustion is from 31.5°S to 34.9°S. 

An example flight path is shown in Table 4 below.
RG_Table4
Table 4: Example flight path fitting constraints as described in the text. 

This flight path/end point also fits with the floating debris spotted in satellite imagery and in airborne reconnaissance photos, and the drift analysis of MH370 debris found in the western Indian Ocean region, although for the purpose of this paper such considerations were discarded. 

Unfortunately, the current ATSB priority search area stretches from 35.5°S to 39.5°S along the 7th arc ±40 NM, so that the failure to find sunken wreckage from MH370 below its crash site is not surprising. 

The underwater search has produced no results so far and the assumptions made in determining the ATSB priority search area should be re-examined. My view, based on the analysis summarized in this paper, plus preceding papers, is that the search area should be re-focused to cover 31.5°S to 35.0°S along the 7th arc ±10 NM.