All posts by Duncan

Possible Flight Path for MH370 Ending North of the Current Search Zone

Possible Flight Path for MH370 Ending North of the Current Search Zone

Victor Iannello, ScD,
June 25, 2016


(See also the addendum at the end of this post.)

Introduction

The underwater search for debris from MH370 has been unsuccessful so far. The current search zone in the Southern Indian Ocean (SIO) consists of a total of 120,000 square kilometers of seabed, of which 105,000 square kilometers (88%) have been searched to date. There have been no announcements from Malaysian, Australian, or Chinese officials indicating that the search will continue after the scanning of the current search area is completed.

The definition of the current search zone, shown in Figure 1, is based on reconstructed flight paths that are derived from available radar data combined with an analytical interpretation of satellite communications data. In December 2015, a comprehensive study of reconstructed flight paths was completed by Australia’s Defence Science and Technology Group (DSTG) [1]. The satellite data suggest that the aircraft continued to fly for nearly six hours after the last radar capture. As the satellite data are insufficient to determine the precise flight path of MH370, other constraints are imposed on possible flight paths that result in the definition of a more manageable search area. These constraints relate to performance of the B777-200ER aircraft as well as pilot inputs to flight controls. The ability to accurately define the search area is therefore limited by the accuracy of these constraints, and in particular, the accuracy of assumptions related to how the aircraft was flown by the pilots, including whether or not there were pilot inputs during the final hours of the flight.

In the past year, debris from MH370 that has drifted west across the Indian Ocean has been recovered from the shores of La Reunion, Mozambique, South Africa, Mauritius, and possibly Tanzania. Godfrey [2] and others have investigated the drift patterns of floating debris from various possible crash sites, and conclude that the crash site might have occurred outside and to the northeast of the current search zone shown in Figure 1. This could explain why no debris on the seabed has yet been found in the current search zone.

In this paper, we re-visit some of the assumptions that were used to define the current search zone and propose a possible flight path that ends northeast of the current search zone and is consistent with drift studies performed by Godfrey [2].


Definition of Current Search Zone 

After the last primary radar capture of MH370 at 18:22 UTC, the only data we have to reconstruct the flight path are the satellite data “pings”. The log-on sequences at 18:25 and 00:19 along with the handshakes at 19:41, 20:41, 21:41, 22:41, and 00:11 provide Burst Timing Offset (BTO) data and Burst Frequency Offset (BFO) data, while the failed telephone calls at 18:40 and 23:14 provide us with only BFO data.

We can use the BTO data to determine the distance between the aircraft and Inmarsat’s I3F1 satellite, which relayed two-way communications between the ground earth station (GES) in Perth, Australia, and the aircraft. This information can in turn be used to determine a “ping arc” of possible positions of the aircraft for each BTO data point. The BFO data, on the other hand, can be used to determine the approximate direction of the aircraft to discriminate, for example, between northerly and southerly trajectories. The details of these calculations have been presented elsewhere, such as Ashton et al. [3]. The last BTO value at 00:19 provides us with the best-estimate of possible locations for the crash, and this ping arc is known as the “7th arc” because it is the seventh BTO burst in the sequence of bursts starting at 18:25.

In addition to the speed and track, the value of the BFO is strongly influenced by the vertical speed of the aircraft, i.e., a climb and a northerly velocity for the aircraft both influence the BFO in a positive sense. If the vertical speed is not known, it becomes difficult to use the BFO to determine the direction of the aircraft. For instance, a particular value of BFO may indicate a trajectory to the south and level flight, or a trajectory to the north and descending flight. This ambiguity is removed if the flight is known to be level, for instance, at a particular time.

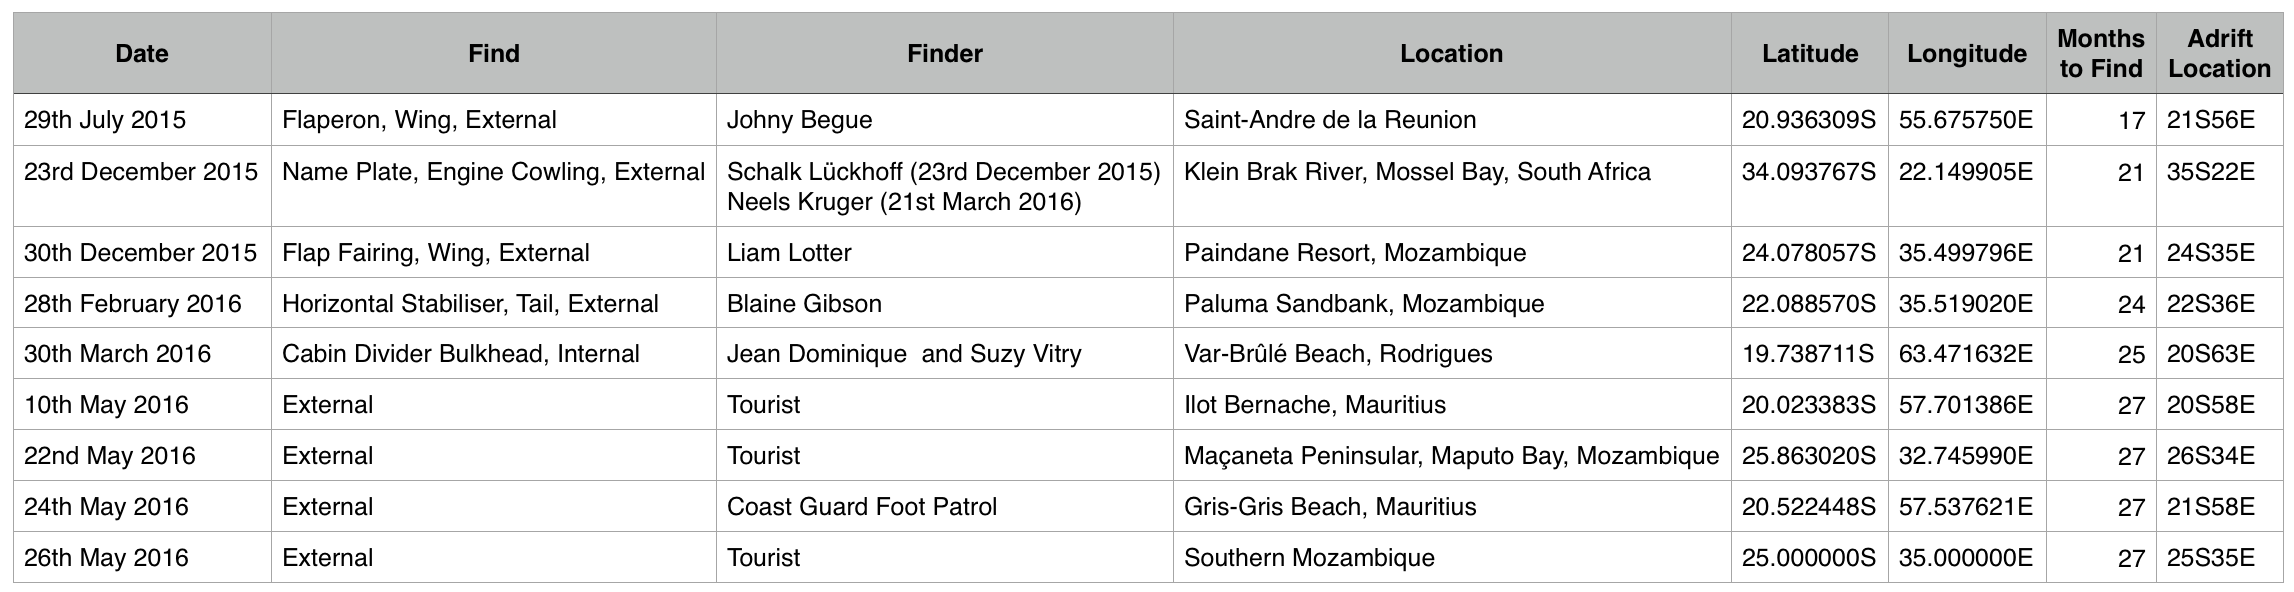
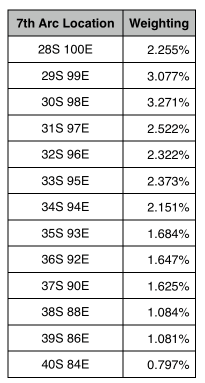
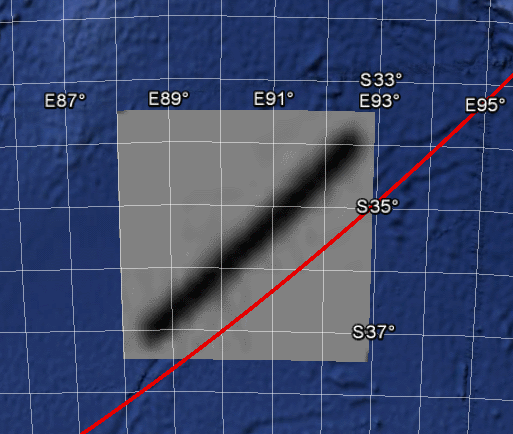
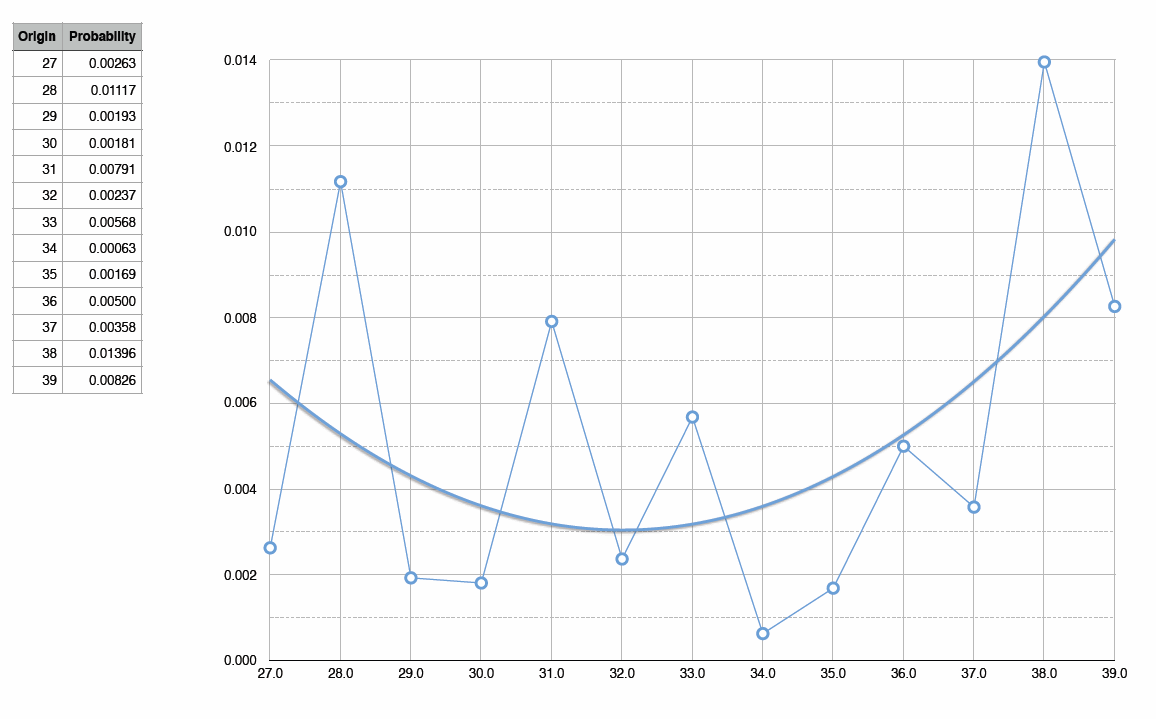
In an attempt to help define the search area, a detailed analysis of possible reconstructed flight paths was performed by the DSTG [1] using probabilistic methods. By assuming that random manoeuvers which change the speed and direction of the aircraft occur at randomly distributed intervals, and using previous commercial flight data to calibrate the stochastic model, a distribution of possible end points in the SIO was generated. Using the BFO data at 18:28 and 18:40, and assuming level flight, the DSTG analysis predicts that a turn to the south occurred at some time between 18:28 and 18:40. The probability distribution of the location of MH370 from this analysis is shown in Figure 1, which shows the highest probability at a position on the 7th arc near 38S latitude.

Vfig2

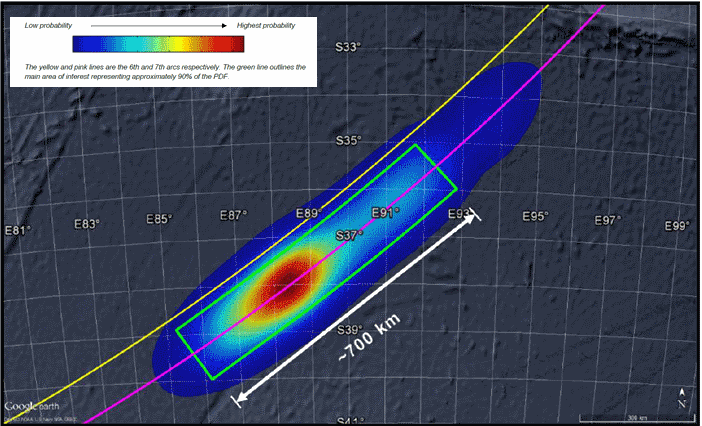
Figure 1. Probability distribution for location of MH370
from DSTG study [1].

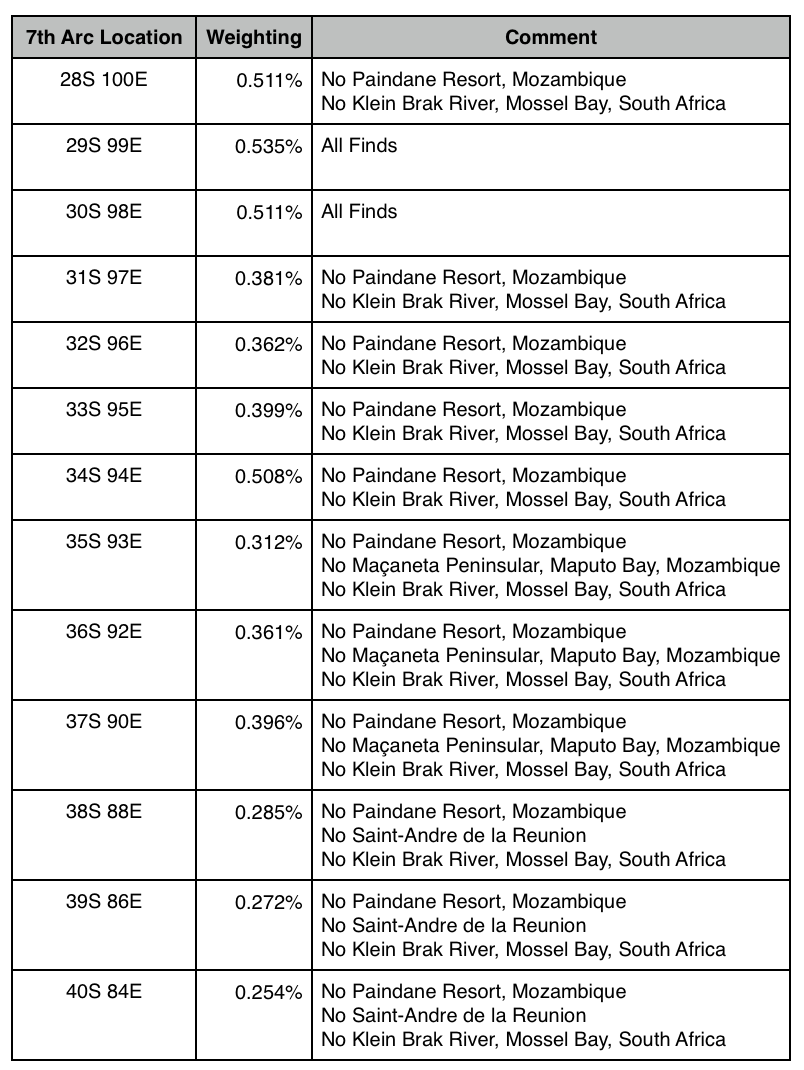
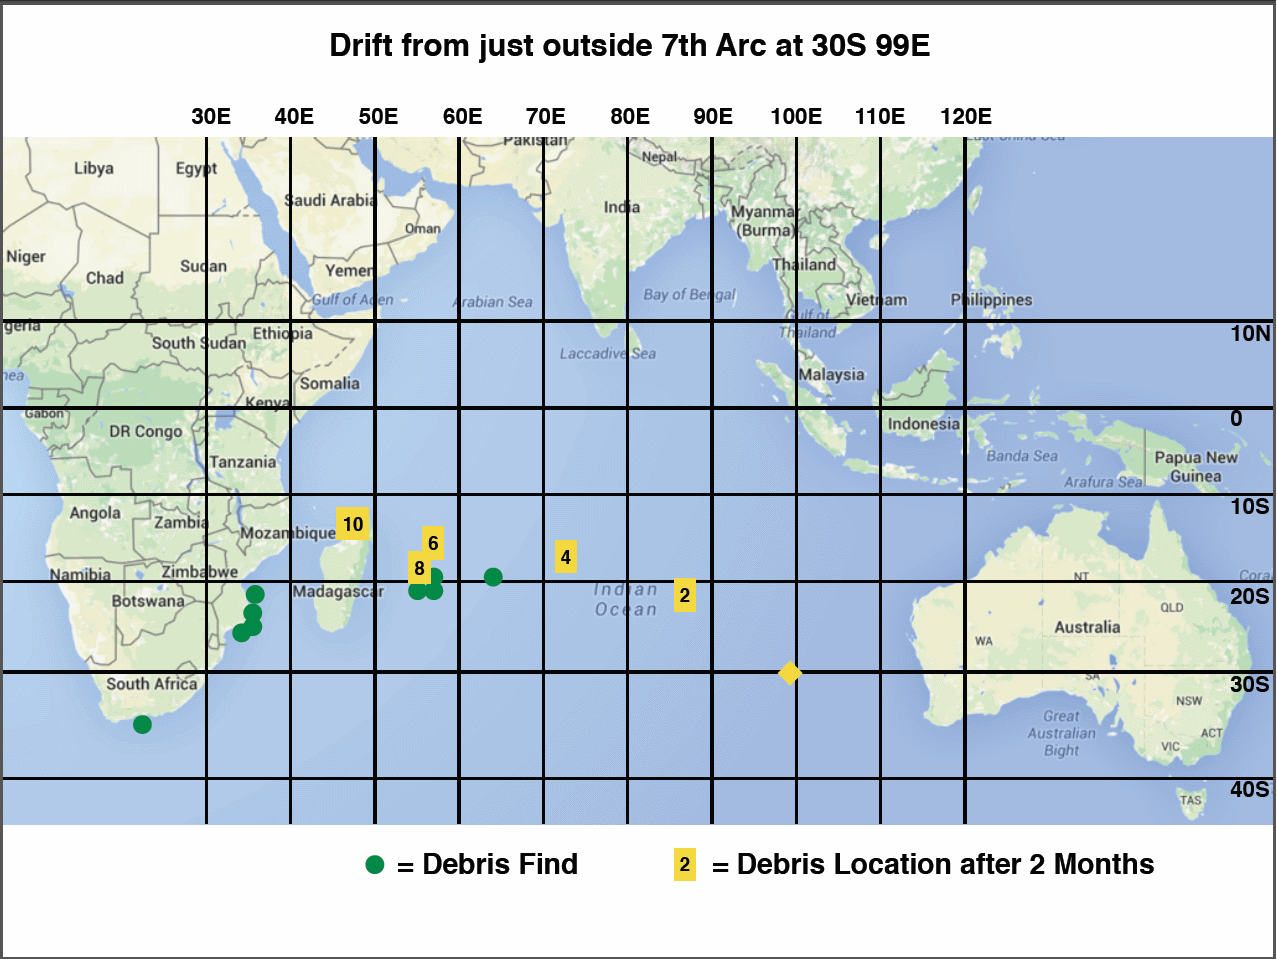
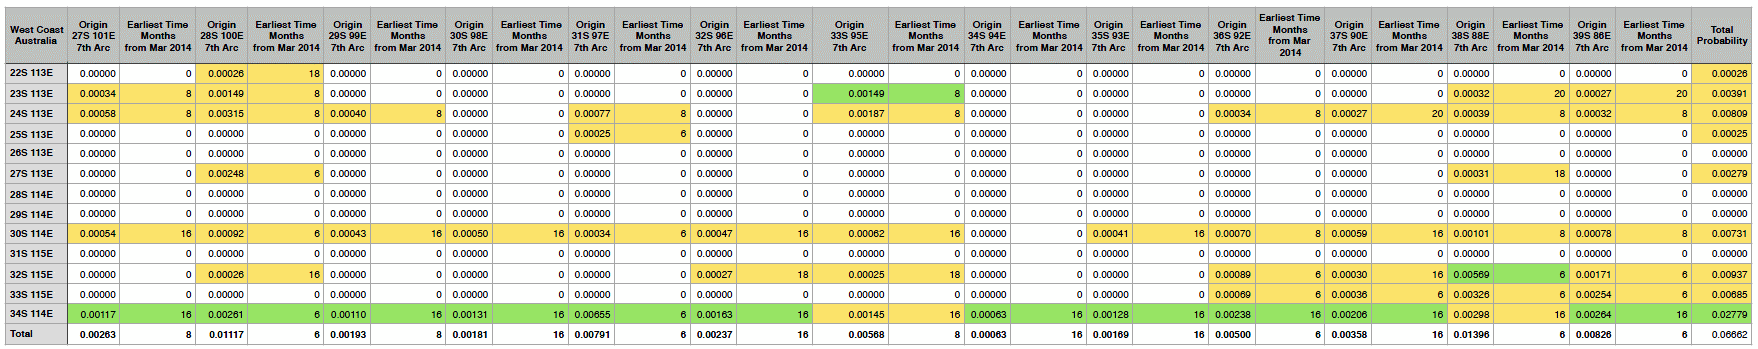
Unfortunately, the search for debris on the seabed in the area defined by the DSTG analysis has been unsuccessful to date. Additionally, the timing and location of recovered debris from MH370 that has drifted across the Indian Ocean and landed in La Reunion, Mozambique, Mauritius, and South Africa suggest that MH370 might have crashed to the north of the current search area. For instance, Godfrey [2] performed drift studies of recently recovered debris which suggest a location along the 7th arc that is near 30S latitude. The failure to find the debris in the current search area combined with results from the drift studies provides a motivation to revisit the assumptions that were used in reconstructing possible flight paths.

Here, a possible flight path is proposed that terminates to the north of the current search area. The main differences in assumptions between the DSTG study and the present work are:

  1. In the DSTG study, the aircraft was assumed to be flying nearly level at 18:40 and on a southerly course. In the current study, the aircraft was assumed to be descending at 18:40 and following a northerly course until about 18:58. The later turn to the south produces an end point to the north of the current search area.
  2. At some time before 19:41, the aircraft began traveling along a path of constant magnetic heading and was slowly descending.
  3. There were no pilot inputs after 19:41, i.e., the aircraft was on a path of constant magnetic heading, scheduled speed, and constant (negative) vertical speed.


Methodology to Reconstruct Flight Paths

The methodology to reconstruct the flight paths is similar to what has been presented by others, including the published work of Ashton et al. [3]. A BTO value defines an arc on the surface of the earth, and paths can be reconstructed that cross these arcs at the appropriate time by matching the satellite-aircraft range. (The exact position of the arc depends on the altitude of the aircraft. At higher altitudes, the arc is located further from the subsatellite position.) The paths were reconstructed by forward integrating in time and matching within a tolerance of 10 km the satellite-aircraft range at handshake times as derived from the BTO values and the satellite position. The model includes an accurate parameterization of the satellite position and velocity, meteorological data, and the earth’s ellipsoid geometry. The satellite position and velocity vectors are estimated using the PAR5 parameterization of Rydberg [4], which agrees well with the position and velocity vectors presented by Ashton [3]. The earth is modeled as an oblate spheroid using WGS84.

Meteorological data were included in the analysis in order to properly model the effect of temperature and wind on speed and direction. The meteorological data for March 8, 2014 at 00:00 UTC were extracted from the GDAS database by Barry Martin [5], where data are available with an altitude pressure resolution of 50 hPa and a surface resolution of 1 deg in latitude and longitude.

After flight paths were reconstructed using the BTO data, the predicted values of BFO were compared to the measured values to ensure that match was within an acceptable tolerance of 20 Hz.


Vfig1

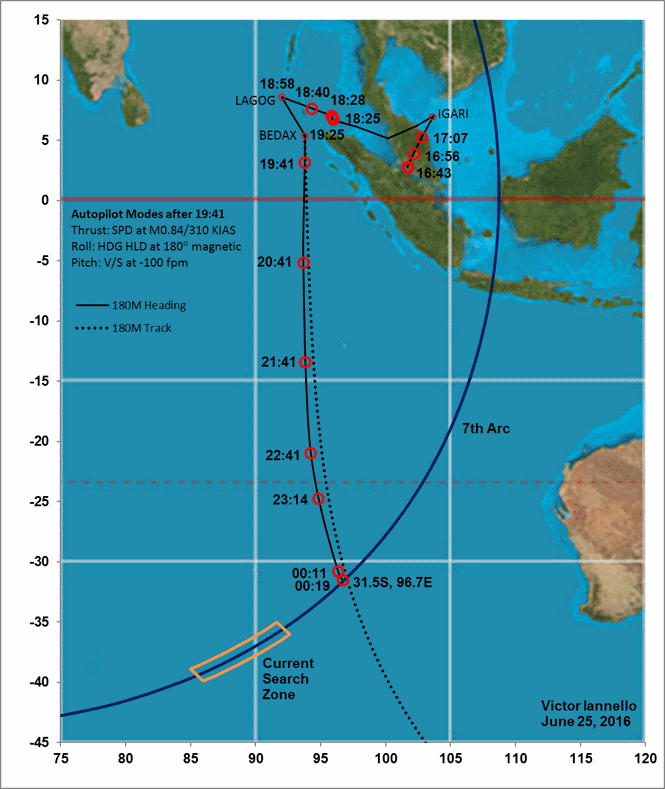
Figure 2. Flight path ending north of the current search zone.


Possible Flight Path Ending North of the Current Search Zone

The particular flight path of interest is the solid line shown in Figure 2. After the last radar capture at 18:22, we assume the aircraft continued to fly northwest, roughly following airway N571 to waypoint LAGOG, which it reached around 18:58. (The BTO and BFO data sequence between 18:25 and 18:28 suggest there might have been a small, lateral, side-step manoeuver to the right, but this does not change the end point location in a significant way and will therefore not be discussed here.) At waypoint LAGOG, the aircraft turned southeast towards waypoint BEDAX. Upon reaching BEDAX at around 19:25, the aircraft turned towards a heading of 180° magnetic, and continued on this heading for the remainder of the flight.

If the aircraft flew a track in which its path after BEDAX was always exactly in the direction of 180° magnetic, it would follow the path shown as a dotted line in Figure 2. The reason why this path deviates from the path of constant heading (solid line) is because of the prevailing wind pattern, which was blowing towards the west for positions to the north of about 22S latitude and blowing towards the east for positions to the south of 22S latitude.

As the dotted line in Figure 2 shows, the track of constant magnetic direction curves to the east at lower latitudes. This is due to the increasing deviation along the path between the magnetic north pole and the true north pole. This deviation is known as magnetic declination. The consequence of this curving is that constraining the aircraft to cross the ping arcs at the appropriate times requires that the ground speed of the aircraft reduces as the aircraft travels south.

The possibility that the aircraft’s speed continuously changed along the path was not considered in the DSTG study [1]. Here we consider the possibility that at a time near 19:41, the aircraft was at an altitude of around 38,800 ft and on autopilot with the following settings:

  • Roll mode: Heading Hold at 180° magnetic
  • Thrust mode: Speed at M0.84 followed by 310 KIAS after descending past the cross-over altitude of 31,560 ft
  • Pitch mode: Vertical Speed of -100 fpm (descending)

The descent rate of -100 fpm is the smallest rate of descent that is possible by setting a vertical speed. At this rate of descent, if fuel exhaustion had not occurred, the plane would have descended into the sea on March 8 at about 02:08 UTC, or a little under two hours after the estimated time of fuel exhaustion of 00:15. At 00:19, the aircraft is predicted to be in a steep descent of -4560 fpm.

Values for selected flight parameters is included in the following table:

Vtab1

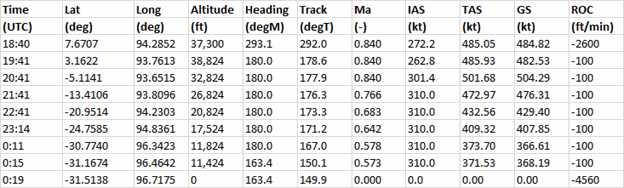
Table 1. Flight parameters at selected points along path.


Conclusions

The present work revisits some of the assumptions used to reconstruct possible flight paths for MH370. In particular, by assuming the aircraft at 18:40 was traveling to the northwest and descending, a later turn to the south is predicted, resulting in an end point further to the northeast than the current search zone. By assuming the aircraft after 19:41 was on autopilot and in a constant state of slow descent, following a path of constant magnetic heading of 180°, a curved path was reconstructed that matches the satellite data and crosses the 7th arc near 31.5S latitude. This end point is consistent with drift studies that predict a possible crash point along the 7th arc at around 30S latitude, and should be considered for further investigation.


Acknowledgement

The author is grateful for comments and corrections provided by fellow Independent Group members: Brian Anderson, Duncan Steel, and Richard Godfrey.


References

[1] Davey, S., et al., “Bayesian Methods in the Search for MH370”, Defence Science and Technology Group, November 30, 2015, https://www.atsb.gov.au/media/5733804/Bayesian_Methods_MH370_Search_3Dec2015.pdf .

[2] Godfrey, R., “What the Nine Debris Finds May Tell Us about the MH370 End Point”, June 2, 2016, https://www.duncansteel.com/archives/2652 .

[3] Ashton, C., et al., “The Search for MH370”, Journal of Navigation, October 7, 2014, http://journals.cambridge.org/download.php?file=%2FNAV%2FNAV68_01%2FS037346331400068Xa.pdf&code=38b6842b760772f03a840b894cced959 .

[4] Rydberg, H., http://bitmath.org/mh370/satellite-par5-ecef.txt.gz

[5] Martin, B., http://www.aqqa.org/MH370/models/NCEP/GDAS_FNL/gdas2014030800f00.txt


Addendum regarding the large debris item found in Tanzania:
A discussion of the photographic evidence for this being a part of the right outboard flap from a B777 has been conducted by Mike Exner and Don Thompson; it is available here


What the nine debris finds may tell us about the MH370 end point

What the nine debris finds may tell us about the MH370 end point

Richard Godfrey
2016 June 2nd
Introduction
There have so far been  a total of nine finds of debris that are either suspected or confirmed to be from MH370. These are as tabulated below. 

The Rolls Royce name plate from an engine cowling was found twice, firstly by Schalk Lückhoff carrying many barnacles, and then three months later by Neels Kruger, denuded of barnacles.

This has led to the hypothesis that debris items clear of barnacles may have arrived several months earlier than the date of the find, the barnacles having been lost by the debris item after beaching through various mechanisms (physical abrasion; death of the barnacles; etc.).
Debris Finds
Method
In this analysis, I have assumed that all nine debris finds are from MH370. 

I used the Adrift model using the forward drift data starting at March 2014.

I found the probability for each point along the 7th Arc subject to two different assumptions:

(1) Assuming that we did not know the time of arrival; and

(2) Assuming that the time of arrival was the fastest possible given by the Adrift model.

For Method (1) I summed the probabilities for the timeframe between the fastest possible time point and the time point of the find to give a weighting.

For Method (2) I used the probability for the fastest time point only for each find and summed those values.

For both methods, it is possible that individual probabilities are zero.


Results
Using Method (1), the accumulated probabilities for all nine debris finds show a peak at 30S 98E on the 7th Arc as shown in the table and graph below.
Debris Finds vs Origins along 7th Arc - Data reduced
Debris Finds vs Origins along 7th Arc - Graph
Using Method (2), the single probability summed for each of the nine debris finds shows a peak at 29S 99E. The graph below shows another peak at 34S 94E, but this does not fit all debris finds (i.e. although the summed probabilities may render a large result, some end locations/find locations are found to have a zero probability in the Adrift model).
Debris Finds vs Origins along 7th Arc Earliest Month - Graph
 
Only two putative MH370 end points on the 7th Arc fit all the debris finds, as indicated in the table below: 29S 99E and 30S 98E.
Debris Finds vs Origins along 7th Arc Earliest Month - Data
Using Method (2), I checked whether there was a possibility that the MH370 end point was either inside or outside the 7th Arc.

There was a clear peak or hot spot at 30S 99E just outside the 7th Arc, almost twice any peak along the 7th Arc, as shown in the following table (red: geographical bins along the 7th Arc; green: the bin containing the peak probability).
Debris Finds vs Origins Earliest Zoom reduced
Discussion
The debris find at Mossel Bay, South Africa by Schalk Lückhoff and then 3 months later by Neels Kruger, as well as the find at Paindane Resort, Mozambique by Liam Lotter, fit only this hot spot and surrounding cells as a point of origin. 

The indicated average drift speed of the recovered debris is 0.37 knots, the maximum speed being 0.68 knots.

The map below shows the fastest drift from 30S 99E using the Adrift model. The yellow diamond shows the location of 30S 99E (i.e. the MH370 end point indicated above). The yellow squares give the mean locations of drifting debris after the stated number of months in each case. The green circles are the locations of the debris finds.
Indian Ocean Drift Map 30S 99E


On this basis it would seem likely that most of the drift items have reached the places where they were found several months before they were identified (i.e. they may have spent some considerable time on or near the coastlines/beaches).

For MH370 to have crashed at near 30S two possibilities immediately suggest themselves: either the flight south was “low and slow”, or the path of MH370 included a loiter around Sumatra and the Andaman Islands before heading south. The latter case would require that although the BFO data shows a southerly direction at 18:40, subsequently MH370 circled back before finally heading south.

Victor Iannello has suggested a third possibility: that the plane turned toward the south later than 18:40, and the BFO value at 18:40 is the result of a descent. This allows cruise speeds for the entire path and no loiter. It is interesting that the region around 29-30S was the hot spot suggested by the ATSB in their June 2014 report, in which the BFO at 18:40 was ignored for unknown reasons. Perhaps the ATSB was right after all, to initially ignore the BFO at 18:40.
Don Thompson has noted that a lower flight level may have been an intentional consideration: the cruise altitudes of flight routes from Australia to the Middle East would be in the path of an aircraft (i.e. MH370) heading south from its final major turn, and adopting a lower altitude would avoid the possibility of a collision.
Conclusion
The area around 30S 99E should be considered as a hotspot for underwater searching, as soon as all nine debris finds are confirmed as from MH370.
It is noted that drift modelling such as that employed here of necessity contains various vagaries and conditional outcomes. Alternative drift models should be used to check the above results, and it is urged that others should use such models so as to verify (or not) the results obtained here.
The possibility still remains that some contingent events (e.g. particular storms) may have made it feasible for the debris items that have been found in South Africa and Mozambique to have started out further south than 30S (e.g. the subsidiary peak near 34S mentioned above), but the discovery of the latest four items in Mauritius and Mozambique (yet to be confirmed to be from MH370) adds weight to the previously-stated result from drift modelling that MH370 appears unlikely to have crashed to the south of 36S. 


Acknowledgements
I am indebted to Dr Erik van Sebille of Imperial College, London, and the Adrift organisation.

I am also indebted to Henrik Rydberg, Mike Exner, Victor Iannello and Don Thompson of the Independent Group for their helpful suggestions in preparing this paper.

Implications of the Absence of MH370 Debris on the Coast of Western Australia

Implications of the Absence of MH370 Debris on the Coast of Western Australia

Richard Godfrey and Duncan Steel
2016 May 11
Updated May 12


Introduction
Several different people/groups have published reports on the drift modelling of floating debris from MH370. Brock McEwen’s Comparative Analysis of drift studies (2015 December 07) is available here. Most recently (2016 April 25) he has published MH370: Probabilistic Analysis of Shoreline Debris, which is available here.

There is an important conclusion in McEwen’s report, which prompts the present post here. He finds that, based on modelling carried out by researchers at the International Pacific Research Center (IPRC) at the University of Hawaii, if the crash occurred in the priority search area then there should have been dozens of items of MH370 debris found on the coast of Western Australia by now, and yet there have been no such confirmed identifications. As McEwen states in an email message, “The bottom line seems inescapable: either IPRC’s probabilities are wrong, my model is wrong, or the current search area (36-40 degrees south latitude) is wrong.

(Note that, as described below, the IPRC extended start line for their drift modelling stretches from 34S to 37S; however, it is non-coincident with the 7th arc, as McEwen pointed out, but rather lies some distance to the northwest of that arc, as is confirmed below.)

The core question that is addressed in this post is as follows:

Can we reconcile the discovery of debris in the western Indian Ocean along with the non-discovery of debris on the coast of Western Australia with a crash location on or near the 7th arc, and if so what does this tell us about where the crash occurred, in terms of the latitude (near the arc)?


An Omission from the First Version of this Post (May 11)
It is noted that an analysis by Henrik Rydberg published in early-August 2015, soon after the flaperon was discovered in La Réunion, addresses all the essential points covered in the present post, and more; we apologise to Rydberg for having omitted to mention his analysis in the May 11 version of this post. Further discussion of Rydberg’s conclusions are included at the end of this post.


A few background comments
Working out likely end-points for floating MH370 debris from any putative crash location on or near the 7th arc between 29S and 40S can be very confusing.

Whilst the West Australian Current (WAC) would be expected to pick up such debris and carry it initially north-east, this does not imply that any must end up on the coast of Western Australia (WA). (Note that the “coast of WA” in question here is limited to that facing west onto the Indian Ocean, and not the coast from Albany eastwards, nor that eastward of, say, Port Hedland or Broome.) The WAC trends anti-clockwise and feeds into the westward-flowing South Equatorial Current (SEC) which would then be able to take floating items to locations where MH370 debris has been found in the western Indian Ocean (Réunion, Rodrigues) and on the African coast (Mozambique, South Africa), with some passing to the north of Madagascar and some to the south. Some items will turn southwards out of the SEC before reaching the longitude of Madagascar, and some others will make that turn (continuing anti-clockwise) in the Agulhas Current off the southern coast of South Africa, and then return in another year or so from now to the approximate region where they started (i.e. the MH370 crash site).

Returning to the WAC and the floating debris carried in it, the flow is broadly parallel to the WA coast, and northwards. Between the WAC and that coast, however, is the Leeuwin Current (LC), which flows southwards, largely over the continental shelf (which extends a long way westwards from the coast, especially at latitudes north of Geraldton). As the Wikipedia page for the LC says, “The West Australian Current … produced by the West Wind Drift in the southern Indian Ocean … flow[s] in the opposite direction, producing one of the most interesting oceanic current systems in the world.”

What this would appear to mean is that for debris from MH370 to reach the coast of WA (so as to be found there on the beaches or rocks) it must drift slightly eastwards out of the general WAC and then be picked up by the counter-flowing LC, and make land from there. A partial barrier to this is posed by upwelling at the edge of the continental shelf; such upwelling also occurs at Broken Ridge.

An immediate response to the above overall picture (if it is correct) is that the places one would look for MH370-derived items might be the islands of Shark Bay, and the reefs of the Houtman Abrolhos further south, off Geraldton. However, there will be others with far better knowledge of where jetsam and flotsam tends to wash up, and its origins.


The IPRC start locations are not on the 7th arc
The IPRC researchers state that their assumed source (i.e. range of start positions in their drift study) is “equi-distributed between 37S and 34S along the 7th arc” (e.g. the caption to their Figure 2 on this webpage). However, this appears not to be the case, as was indicated by McEwen (see Figure 19 in his Comparative Analysis). As he noted, the extended source used in the IPRC study seems to be a line that is curved, and is inside the 7th arc but is not parallel to it; the line does run from 37S to 34S though.

To confirm the location of the IPRC-assumed source (set of starting points) their Figure 3 (which plots their source line with a white background) was georeferenced, converted into KMZ format, and brought into Google Earth. The resultant screen grab is shown below, with the 7th arc at 35,000 feet plotted in red for reference.

(For anyone who wants it, the KMZ file for that IPRC line is available here; and the 7th arc KMZ file is here.)

IPRC_arc

Figure 1: The red line indicates the 7th arc for an assumed altitude of 35,000 feet, and the broad black line shows the IPRC-assumed source for drift modelling, which lies about one degree to the northwest of that arc.

The reason for this discrepancy is not known at this stage. Obviously such a simple error leads one to question the veracity of the overall results obtained, but for present purposes it will be assumed that the IPRC drift modelling outcomes do indeed represent what might be anticipated to occur given the extended source location shown above.

It might be noted that, naïvely, one might suppose that floating items modelled as starting from the IPRC source would seem less likely to reach the coast of WA than items actually starting their drift further east, on the 7th arc.

In passing it is noted that it is unfortunate that the IPRC drift modelling results as publicly available are aggregated for all points along their line between 34S and 37S; it would have been useful to be able to compare results for, say, start points at 34S, 35S, 36S and 37S, as will become clear from the discussion below.


Drift Modelling Analysis
The drift modelling described here makes use of the Adrift website. The coast of WA was defined for locations between 22S 113E south to 34S 114E as shown in the far left column in the table below.


RG11

Table 1: Drift probabilities and earliest arrival times on the WA coast for different assumed start locations near the 7th arc. 

For each assumed point of origin of debris between 27S and 39S near the 7th Arc (longitudes rounded to the nearest degree so as to fit against the required inputs for the Adrift model), the earliest time when the coast was reached was determined. These times (the model uses two-month jumps) are shown in the table above, along with the associated probabilities of reaches those points on the coast from the stipulated starting positions.

It is emphasized that the results appear ‘noisy’, with apparent jumps in probability that seem unphysical, some coastal locations being indicated to have zero probability of receiving debris whilst adjacent locations have substantial values. The results can therefore be regarded only as giving some general indications of what may have occurred.

This noisiness can be easily seen in the chart below, wherein the total probabilities of reaching the shore of WA for each origination point are plotted against the latitude of those start points. A tentative deduction from the best-fit curve shown is that there is a lower likelihood of reaching the WA coast if the crash location were not near the extreme latitudes shown, with the minimum in the curve occurring for latitude 32S, and the minimum in the output data at 34S.


RG10

Figure 2: Summed drift probabilities to the WA coast for different assumed start locations/latitudes near the 7th arc. 

A fundamental observation we are trying to explain here is the fact that MH370-derived debris has been found in the western Indian Ocean, but not on the coast of WA. We should be comparing derived probabilities, therefore.

For an origin (i.e. putative crash location) at 34S, 94E the summed probability for the WA coast in the table above is just 0.00063. From other locations on/near the 7th arc the values are around 0.002 or higher (i.e. summed WA coast probabilities). By comparison, for the ‘No Step’ item found in Mozambique the maximum probability calculated was 0.00202, starting from 30S. For the flaperon found in Réunion, the maximum possibility derived was 0.00134, also for a start at 30S.

On this basis it might be concluded that for the least amount of debris to land on the West Coast of Australia, the most likely MH370 crash location is around 34S 94E on the 7th arc. Further, the low probabilities of debris starting there and arriving there on the WA coast are not inconsistent with the discovery of debris across the Indian Ocean to the west.


Further Discussion
Obviously we would like to understand the above results in terms of how they come about, in case insights might arise that assist the search for the MH370 crash location.

What may be significant is that the 7th arc is close to the east-west divide in ocean currents, for the two months after March 2014. Consider the location identified above (i.e. 34S 94E) as being the least-likely to result in debris reaching the WA coast. The drift path from that point indicates a most-likely heading that is north-westerly (azimuth around 308°).

That value is shown in the table below. In this table are mapped the highest-probability drift directions derived from the Adrift model for the two months commencing March 2014 as a function of initial latitude and longitude. The boxes coloured red indicate the approximate 7th arc (rounding to the nearest degree being necessary). The yellow boxes indicate locations that might have been reached should MH370 have been glided on a continuation of its flight path after fuel exhaustion at the 7th arc.


RG6

Table 2: Drift directions for different start locations across the two months starting with March 2014.


Whilst the directions tabulated might be regarded as being somewhat scattered, reflecting the vagaries of current flows and eddies (and note that in some locations the most-likely behaviour is that floating debris would go nowhere during those two months; i.e. it remains ‘Still’), in broad scope the values in the upper left parts of the table indicate current flows that are generally northwest, whereas those in the lower rights parts of the table indicate current flows more towards the northeast. This is not unexpected, being reflected in the anti-clockwise flow of the WAC.

For example, a crash point at 35S 95E (about 78 NM outside the 7th arc) would normally correspond to the equivalent controlled ditch end point (if fuel exhaustion occurred at 34S 94E). However, 35S 95E is on the other side of the east-west divide in ocean currents and therefore debris will not drift back toward 34S 94E, but rather head off in a north-easterly direction around 052°. The general pattern being an anti-clockwise path, most of the debris that starts off heading north-east will eventually circle round to a northerly, then westerly path.

For those points between 32S and 36S on and just inside the 7th arc the highest probability drift direction for the two months from March 2014 is westward; outside the 7th arc, though, the drift pattern changes to an easterly or north-easterly direction. An initial north-easterly path will still reach the locations of the various finds made to date, it will just take longer to get there than an initial north-westerly path.


Concluding Remarks
Obviously the situation is complicated, and deserves/requires further study. The general picture arrived at, however, is that if the crash of MH370 occurred on or inside the 7th arc between latitudes of 31S-36S then the resultant floating debris may be anticipated to have drifted initially towards the northwest and then been transported across the Indian Ocean by the SEC; under this circumstance it seems that debris arriving on the coast of WA is unlikely, possibly explaining its non-detection.

On the other hand, if MH370 crashed outside of the 7th arc between 31S-36S, or on the arc but further south, then floating fragments are more likely to have drifted to the coast of WA. The non-discovery of debris there argues against such crash locations, therefore.

In 2015 August, on the basis of the flaperon found on La Réunion, Van Gurley (Metron, Inc., Reston, Virginia) suggested that the underwater search should be shifted about two degrees northwards from the ATSB priority search area.  That is, the identification of debris from MH370 in the western Indian Ocean may be interpreted as being indicative of a crash location not so far south as 36-40S, but a few degrees further north, a suggestion that we confirm here. Further, we find here that the  non- identification of debris on the coast of Western Australia may be interpreted as indicating a crash location that is on or inside the 7th arc, which may be regarded as being additional evidence against any scenario in which MH370 is thought to have continued for some distance beyond the 7th arc.

All readers are urged to refer to Rydberg’s analysis from early-August 2015. He identified 34S 94E as being the most likely start point for the flaperon, and made various predictions about where and when debris would arrive onshore elsewhere. Rydberg indicated that a crash location as far south as the ATSB priority search zone was unlikely to have resulted in the flaperon reaching La Réunion; that much more debris would be expected to arrive on shorelines in the western Indian Ocean (and, indeed, another four fragments of MH370 have so far been found); and that comparatively small numbers of debris items should be expected to reach the WA coast, the likelihoods of washing up across the other side of the Indian Ocean being far higher.

The discovery of (so far) a number of MH370-derived debris items on coastlines in the western Indian Ocean but none at all on the shores of Australia therefore present a situation that is consistent with the crash location of MH370 having been further north than the area where the underwater search has been focussed, with 34S 94E being the ‘best bet’ based on analyses using the Adrift model.