Further Studies on the Path of MH370:
Turn Time and Final Azimuth
Sid Bennett and Geoff Hyman
2015 March 20
The Independent Group (IG) operates by consensus and, for the present, there appears to be no compelling reason for the IG to issue a further statement regarding the probable final location of flight MH370. However, individuals and sub-groups have been pursuing details of the data and developing a better understanding of aspects of the event. This report is therefore one which is not intended as a statement by the IG as a whole, and is presented by the writers in order to further technical discussions relating to the likely location of the wreckage.
In particular, the focus of this report is on the flight path from the loss of primary radar contact at 18:22 to the last communication from the aircraft at 00:19 (2014 March 08; all times in this document are expressed in UTC). Details of the final descent are not addressed here.
Since the publication of the interim report by the Malaysian ICAO Annex 13 Safety Investigation team on 8th March 2015, several studies have been produced that detail the flight path from takeoff to the loss of radar contact. An excerpt from an example published online by ‘Orion’ is shown as Figure 1 below.
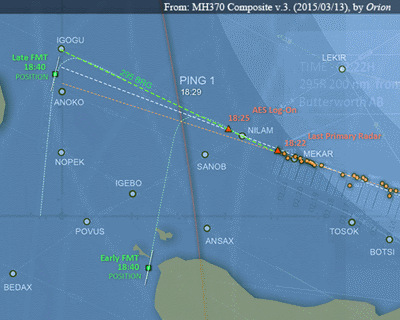
Figure 1: Possible paths of MH370 across the Andaman Sea
according to ‘Orion’.
This portion of the path extends from a time before 18:22, where primary radar coverage existed, into the unknown flight regime thereafter. Consistent with the consensus that the BFO data require that the aircraft turn to the Southern Indian Ocean (SIO), two possible turns were illustrated. The early turn time leads to proposed end points well to the southwest of the current search area along the 7th ping ring, while the turn at 18:40 is consistent with the previously-published IG end point.
The path simulation model (available from this website) used as the basis for the present report was developed by another IG member in response to specifications and recommendations made by the authors and others over the past year. The model simulates both geodesics and loxodromes on a modified WGS84 ellipsoid, and incorporates fuel burn prediction data, a meteorological reanalysis, an analytical solution for the BTO arc, and uses PAR5 satellite vectors (Henrik Rydberg: PAR5 Satellite Vectors for Inmarsat 3F1, based on ATSB vectors; see also this post), and various models for the Inmarsat SATCOM system. Simulated paths are scored by a cost function formulated by Geoff Hyman to quantify the errors in the fit of a single flight path to the combined BFO and BTO evidence. The cost function values enable the probabilities of competing flight path scenarios to be compared, even when the scenarios differ according to a range of different flight parameters.
A strong word of caution is needed here. Ordinarily a mathematical model is validated by testing it against data sets whose meaning is known. In this situation one would wish to use the model to analyze Inmarsat BTO/BFO data sets where the flight path characteristics are well-defined (i.e., routine flights). However, despite repeated requests by the IG for disclosure of such data, which is obviously available to the official investigators, no test set of data has been released. Consequently, one must treat the result as being the analysis of a single experiment without external validation.
Underlying the analysis presented here is the premise that, if the aircraft is to be found, the most probable location is that which can be deduced using a minimum number of arbitrary changes in flight parameters. This premise is, of course, debatable as there is a ‘margin of error’ associated with any specific path, including the most probable. The cost analysis also provides a means for assessing the width of this margin.
Consistent with this philosophy, the flight path is modeled as a loxodrome (rhumb line) having an origin at the last radar contact, making a single turn to the SIO and flying at a constant Mach number.
The predicted measurements of BFO and BTO are compared with the Inmarsat reported data and the combined error of the two measurements is used to optimize the modelled flight path.
An earlier version of this model was used to contribute to the IG recommended ‘end point’ location. That computation was a single path that exhibited the lowest ‘cost’, where ‘cost’ is a measure of the total BTO/BFO measurement error. Since that time, several proposed paths and end points have been proposed by other groups and individuals, and we have tried to understand the assumptions they have made and to compare their results with our work. The major difference between most models is related to the time at which the turn to the SIO is considered to have occurred.
The studies reported herein attempt to clarify this situation. The first study is a determination of the most likely time for the turn to the SIO, which we call the FMT (final major turn), and the second study is an estimate of the probable azimuth range associated with the path subsequent to the turn, where the turn is presumed to have occurred at that most likely time. It should be stressed that paths with lower probability than the maximum probability still remain possibilities, but paths with very low probabilities might be eliminated.
First Study
The path from loss of radar contact at 18:22 is considered to continue at a constant Mach number and an azimuth of 295T until the turn time (i.e. the FMT). The turn time computation granularity was 30 seconds. In this context there are two events of note. At 18:25 the aircraft contacted the Inmarsat system and logged on, creating a sequence of data interchanges (BTO/BFO pairs), and at 18:40 there was an attempt to call the aircraft using the satellite system, which also created a sequence of data interchanges (BFO only).
As an overview of the results, it may be said that a turn to the SIO prior to 18:25 is inconsistent with the BFO at 18:25 because the approximate azimuth implied by the BFO value about near 295T. A turn to the south subsequent to 18:40 is similarly inconsistent with the BFO data at 18:40, which indicates an azimuth of about 192T (i.e. 12 degrees westwards of due south). The latter azimuth is not dissimilar to the final azimuth of approximately 186T that we deduce here, but is also consistent with an early turn occurring after 18:25 to an azimuth of 192T, which would result in the models proposed by other groups and individuals having an end point substantially to the southwest of the current search area (i.e. at latitudes well below 38S).
The results of the turn time study are shown in Figure 2, where the combined errors in the BFO and BTO are expressed as a ‘cost’.
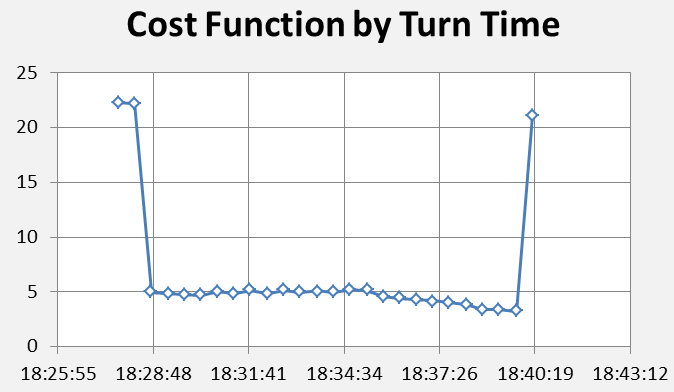
Figure 2: The cost values (a numerical representation of the combined errors or deviations in the measured BTO and BFO values when compared to modelled aircraft flight paths southwards) as a function of the time of the Final Major Turn (FMT).
Cost function values in excess of seven lead to very small probabilities and a turn at those times may reasonably be rejected. Conversely, lower cost function values cannot reasonably be excluded. Figure 3 shows the relative probabilities of the FMT occurring at different times. It may be seen that there is a practical bound of 18:28 for the earliest turn time and of 18:40 for the latest turn time. These are well-determined, and attention might reasonably be confined to this range, at least for conditions resembling those adopted here. The strict bounds on the early and late turn times are seen to arise from the BFO measurements at 18:25 and 18:40. Simulations that begin at a later time, thus neglecting the period considered here, or which use the BTO data exclusively, will not exhibit these characteristics.
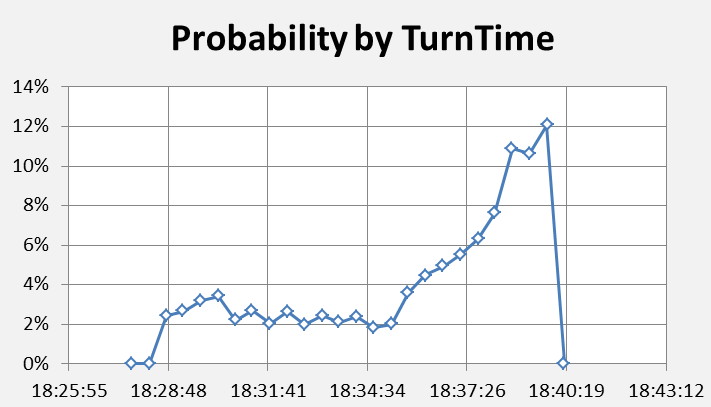
Figure 3: Relative probabilities for different times of occurrence of the final major turn (FMT).
Some of the alternative path models proposed by others use an early turn time. The probability per unit of time for turn time intervals preceding 18:34 is less than about one-third of the probability of turns occurring at or after the median turn time of 18:37; the most-likely individual time for the turn is 18:40 as it has the lowest cost. This turn time is consistent with a FMT at waypoint IGOGU. We have not considered a turn time in the continuum between 18:25 and 18:37 as such turn times do not appear to be the basis of any proposed flight path models. However, another IG member has recently produced path solutions with the FMT occurring at 18:37 and examined a range of azimuths similar to those reported here. It is planned that these will be published in a separate report.
Second Study
Even if the turn is considered to occur at or very near 18:40, the final azimuth of the path is not certain. To explore this facet of the scenario, a series of paths was computed from a starting point at waypoint IGOGU with azimuths in 0.2 degree increments; relative probabilities for azimuths in this series are shown in Figure 4.
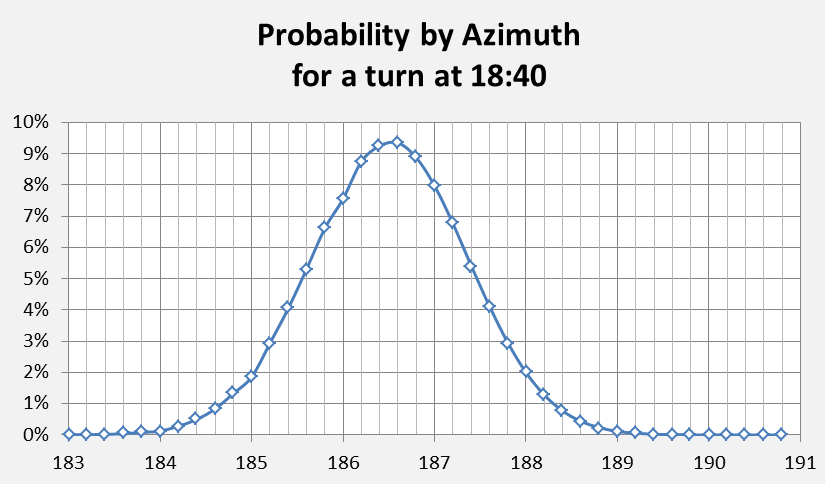
Figure 4: Relative probabilities for different azimuths of the path southwards following a final major turn assumed to take place at 18:40.
This result is consistent with the discrete ‘best path’ result of 186.4T which is discussed below. Extrapolating the path from IGOGU at this azimuth one finds that waypoint ISBIX is overflown. This may be a remarkable coincidence, or might be a consequence of a programmed flight path including IGOGU and ISBIX and continuing on a constant track thereafter. A constant track is one where the ground path of the flight path is at a constant azimuth, and that path does not vary with changing winds aloft.
Figure 5 shows an overview of the likely (i.e. lowest-cost) path of MH370 where the ping rings and times are shown for reference. Waypoints NILAM, IGOGU and ISBIX can be seen to define the early part of the path.
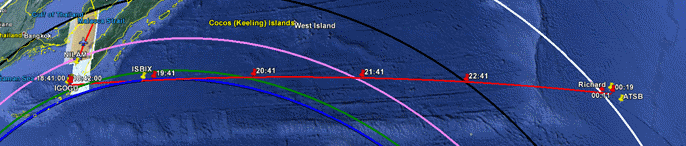
Figure 5: A likely path for MH370 to the Southern Indian Ocean based on our lowest-cost analysis of the BTO and BFO errors
Richard Godfrey’s latest end point at 37.47S, 89.28E , that of the ATSB (estimated centroid, courtesy Mike Exner, from quadrant A1 of Figure 4 in the ATSB report of 8th October 2014 ), and the IG’s ‘most probable’ end point of 37.71S, 88.75E, are also shown in more detail in Figure 6, where the green lines represent azimuths from the FMT of 184T and 188T, the red line is that for 186T, and the white line represents the 6th ping ring.
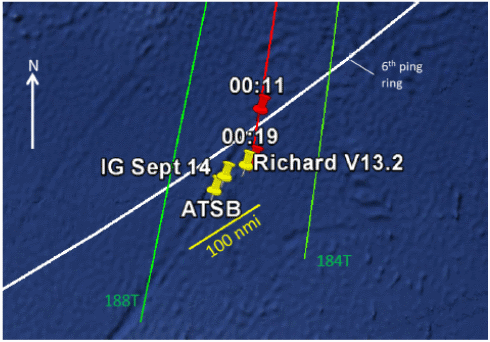
Figure 6: Detail showing three possible end points near 37.6S, 89.0E. The green/red/green lines represent paths from the final major turn at 18:40 on azimuths of 188T, 186T and 184T. Yellow pins show estimated end points as discussed in the main text of this report. The point labelled
IG Sept 14 is that described in the report dated 26th September 2014.
The differences in the end point estimates are not significant in the context of the current search area definition; however, one might consider the current search strategy to be inefficient if the most-likely end points are desired.
From a practical viewpoint, we conclude that MH370 most probably flew a path to the 7th ping ring that is characterized by waypoints IGOGU and ISBIX and a continuation along a constant track. We have not considered any aspect of the final minutes of the flight as this is a subject being studied intensively by others, and will be covered in another report.
The views stated here are personal views and should therefore not be attributed to the IG as a whole, although it is supported by IG members. The information used is that which been made publicly-available from well-known sources and is accepted as valid for the purposes of this study. Having said this, we must express our gratitude to other members of the IG for sharing models and advising on matters of data analysis, communications, avionics and pilotage. We would be grateful if any errors were to be called to our attention.
This report is also available as a PDF download (432 kB) from here.