Estimation of Mean Fixed Frequency Biases: the significance of BFO Channels
Geoff Hyman and Barry Martin
2015 March 19
(Report prepared in 2014 December)
A downloadable PDF of this report (627 kB) is available here.
Background
The focus of this report is the estimation of mean fixed frequency biases (FFBs), for applications to MH370 flight path analysis. This report investigates the extent to which the mean frequency bias is contingent on the number and type of channel associated with burst frequency offsets (BFOs). The approach adopted will be primarily via descriptive statistics; but a degree of hypothesis testing will be unavoidable. It is found that certain combinations of both channel type and number are significant covariates for the mean FFB, meriting consideration in improved modelling of MH370 flight paths. While investigation of the causes of factors of this kind are outside the scope of this paper, additional evidence on causation would be of interest, particularly if it can assist the air accident investigation.
This report represents a continuation of our analysis conducted in recent months, which was earlier restricted to conditions when MH370 was on the ground. The introduction of channel-specific biases has been identified and wider validation of their values is warranted. The current report includes BFO data for the early cruise phase of the flight. The sample size is increased from 131 ground observations to 263 total observations, which effectively doubles the sample size. Whilst the cruise data is somewhat more variable than the ground data, this increase in the sample size is sufficient to provide narrower confidence limits to our estimates.
One of the interesting findings here is that a simple split by channel type (R and T) is not the most effective way of identifying the inter-channel differences. A combination of channel type with channel number is needed for a more effective BFO analysis and in the assessment of competing flight path models.
Introduction
We estimate mean FFBs using ground and early-cruise BFO data, and the PAR5 satellite model (Reference [1]; see also this post).
The sample values of the FFB terms were calculated using [2]:
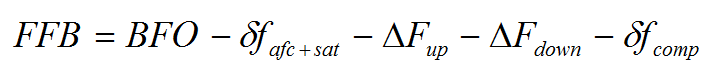
The FFBs are segmented by channel number (4, 8, 10, 11, and 12) and type (R, T). In the current data set channel 8 is the only channel number that appears as both type R and type T. Figure 1 shows the resulting FFBs against time (UTC) during the ground and early-cruise phases, based on the PAR5 satellite positions and velocities [1] and a model for the aeroplane position and velocity.
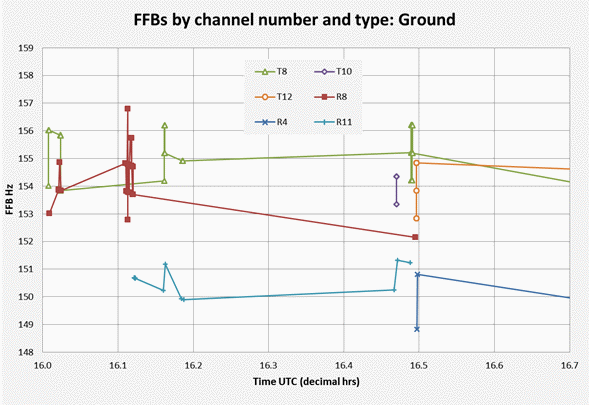
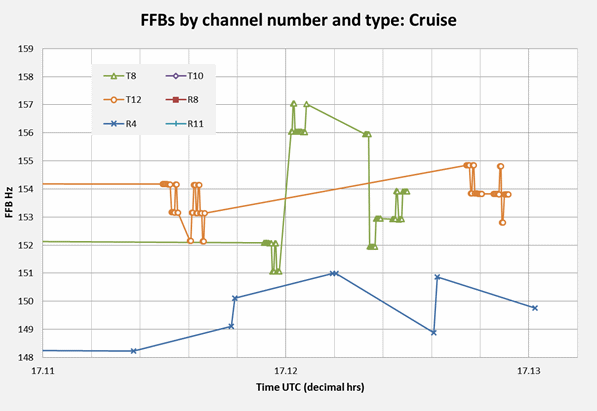
Figure 1: FFB variation over time by channel
Inspection of Figure 1 suggests that only three FFB values (for blue channels R4 and R11) exceed the lowest value for the other channels (151 Hz). This is good prima facie evidence of channels R4 and R11 differing from the others. This topic will be subject to statistical testing, as discussed below.
Table 1 shows, for each combination of channel number and type, the mean FFB, the standard deviation of the FFB, and the standard error of the estimated mean (the standard deviation divided by the square root of the count).
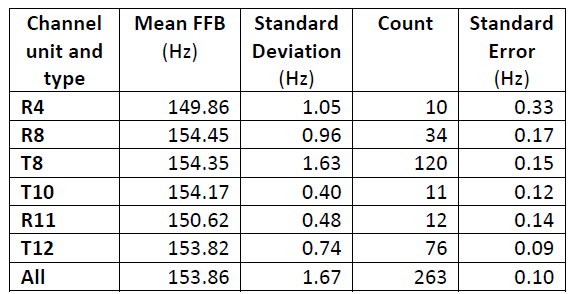
Table 1: Initial FFB Descriptive Statistics by Channel
Stage 1 Tests
We now turn to an issue requiring some basic testing of hypotheses. The first question to be addressed will be: How do estimated FFB means for the BFOs associated with R4 and R11 differ from each other, and is this difference statistically significant? From the numbers given in Table 1 we would clearly expect to obtain a negative result. We will however proceed, for the purpose of illustrating the tests. We apply both a non-parametric and a parametric test. The non-parametric is the Mann-Whitney U-test [3], [4] and the parametric is the Welch-Aspin test [5]. The Welch-Aspin test accommodates both unequal group sizes and unequal group variances. The Mann-Whitney test only requires information about rank and is distribution-free.
Both tests yield a test statistic that is a ratio of a measure of difference to a measure of its standard error. In both tests we will refer to this statistic as its Z-score. We may consider a Z-score in excess of 3, in both tests, to be significant. A Z-score in excess of 5 in both tests (the ‘five-sigma level’) is taken to be highly significant.
Table 2 contains the results for R4 versus R11. The non-parametric Z-score is 1.45 and the parametric score Z-score is 2.13. To reject the null hypothesis both scores were required to exceed 3, so we have not met this condition.
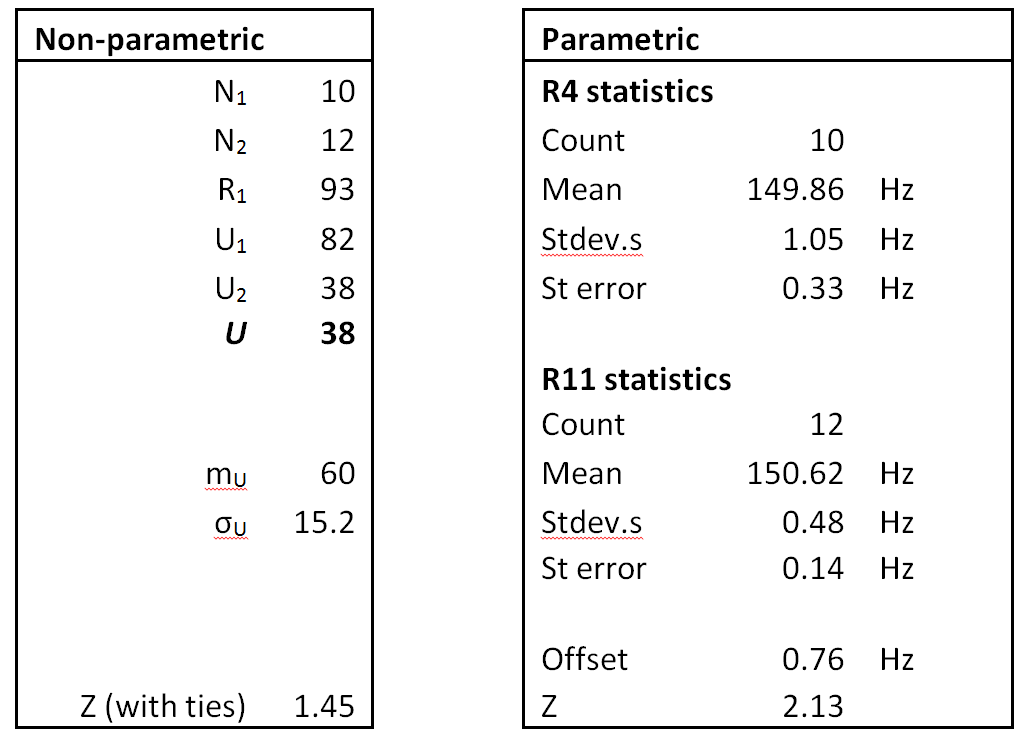
Table 2: Testing for differences between estimated means:
Channel R4 v channel R11
For the purpose of our current estimation task we treat R4 and R11 as equivalent channels. The distributions of the estimated means are presented stylistically below, as ‘spike plots’. These plots have been designed to give a visual indication of how well determined the FFB means are, given the input data being used for estimation. The x-axis denotes the FFB scale in Hz, with the peaks set at the estimated mean values. The width of each spike is two standard errors, one on each side of the estimated mean. The areas under the spikes are designed to be approximately equal, with the height of each spike set at the reciprocal of the corresponding standard error. Spike plots are given both before and after merging R4 with R11.
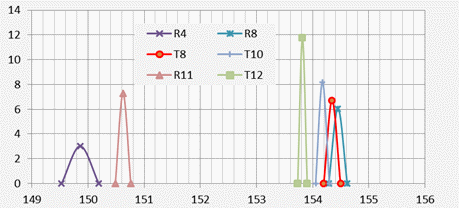
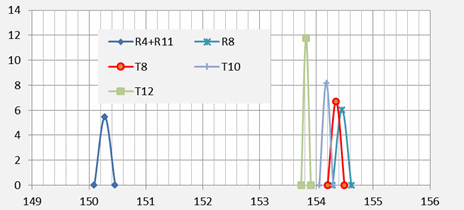
Figure 2: Spike plots by channel, before and after merging R4 with R11
The next test of interest is the statistical significance of the differences between the estimated means for the R4+R11 combination and the combinations of the other channels: T10+T12+R8+T8.
The results are given in Table 3. The non-parametric Z-score value is in excess of 7 and the parametric Z-score value exceeds 19. This is to be taken as a highly significant difference between the estimated FFB means for the R4+R11 combination and the combination of the remaining channels. The relative offset has a value of -3.9 Hz, i.e. the mean FFB for R4+R11 is nearly 4 Hz lower than the mean FFB for the other channels combined. The Z-score values for both tests exceeded the five-sigma threshold, leading to a strong rejection of the null hypothesis so that, in the absence of a true systematic difference, the reported results should typically appear no more than once in (at least) 3.5 million trials.
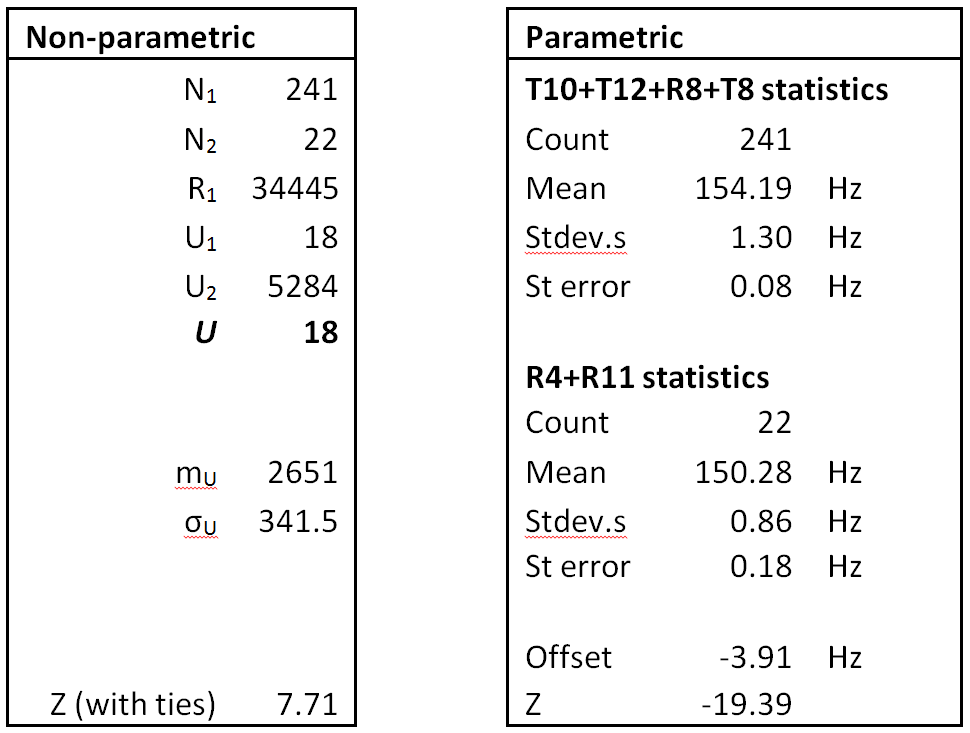
Table 3: Testing for differences between channel
R4+R11 vs all other channels combined
Table 4 provides the descriptive statistics for the resulting two-way split between channels, corresponding to the greatest two-way differentiation available from the data being used. While this may be incorporated in the analysis of flight paths, it is of interest to investigate whether the data would support a further level of discrimination.
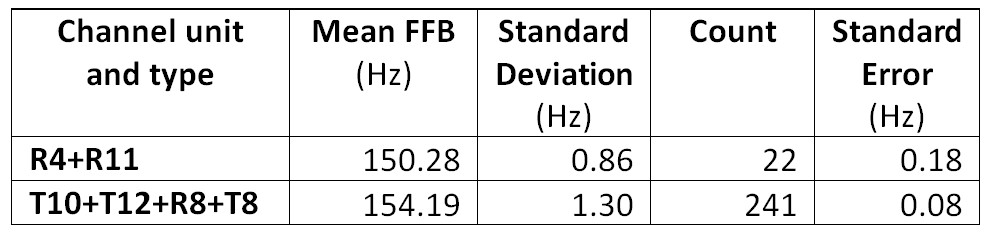
Table 4: FFB Descriptive Statistics after Stage 1.
Now suppose that instead of splitting the channels in this way we had simply split them according to type (R, T). What would we have obtained? Table 3 would have been replaced by Table 5 (below).
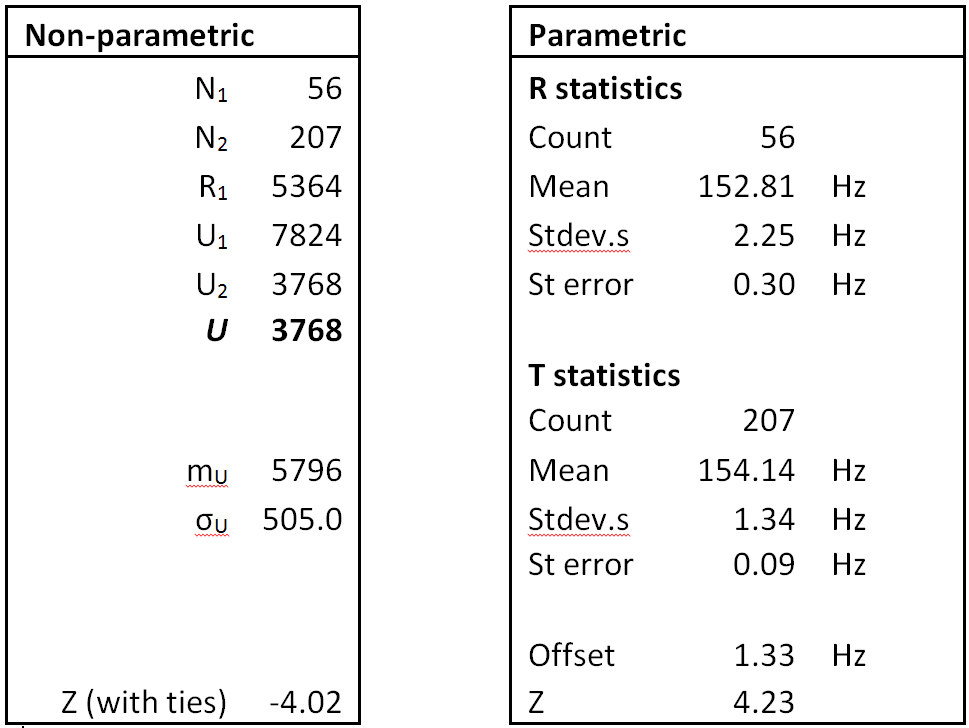
Table 5: Testing for differences between R and T channels
It can be noted that the result of this test produces a significant result, but it is not highly significant (at the 5-sigma level). Further, the relative offset between the T- and R-channels is only 1.3 Hz. The standard deviation for the grouping of R-channels has increased substantially, resulting in wider confidence bands for the mean FFB. On the current data set, the R/T segmentation would be inferior to that given in Tables 3-5 and was not retained for the next stage in the analysis.
Stage 2 Tests
We now take a closer look at the time (UTC) profile of the FFBs for the four unmerged channels: T8, T10, T12 and R8.
From Table 1 it looks like T12 might have a slightly lower mean FFB than the three remaining groups, T8, T10 and R8. If we were to merge the latter three we would arrive at the grouping of channels depicted in Figure 3.
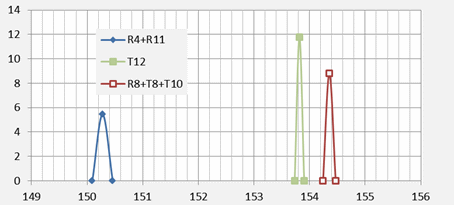
Figure 3: Spike plots by channel combination,
after merging R8, T8 and T10.
How does the estimated mean FFB for T12 differ from the estimated mean FFB for the R8+T8+T10 combination? The results of the two tests are given in Table 6. The Z-score values for both tests exceeded the three-sigma threshold, indicating that, in the absence of a systematic difference, the null hypothesis would be incorrectly rejected with an (estimated) expected frequency of less than one in 300. The result is considered significant, but not highly significant. The relative offset is 0.54 Hz, so that the mean FFB for T12 is approximately one half of a hertz (0.5 Hz) smaller than the others.
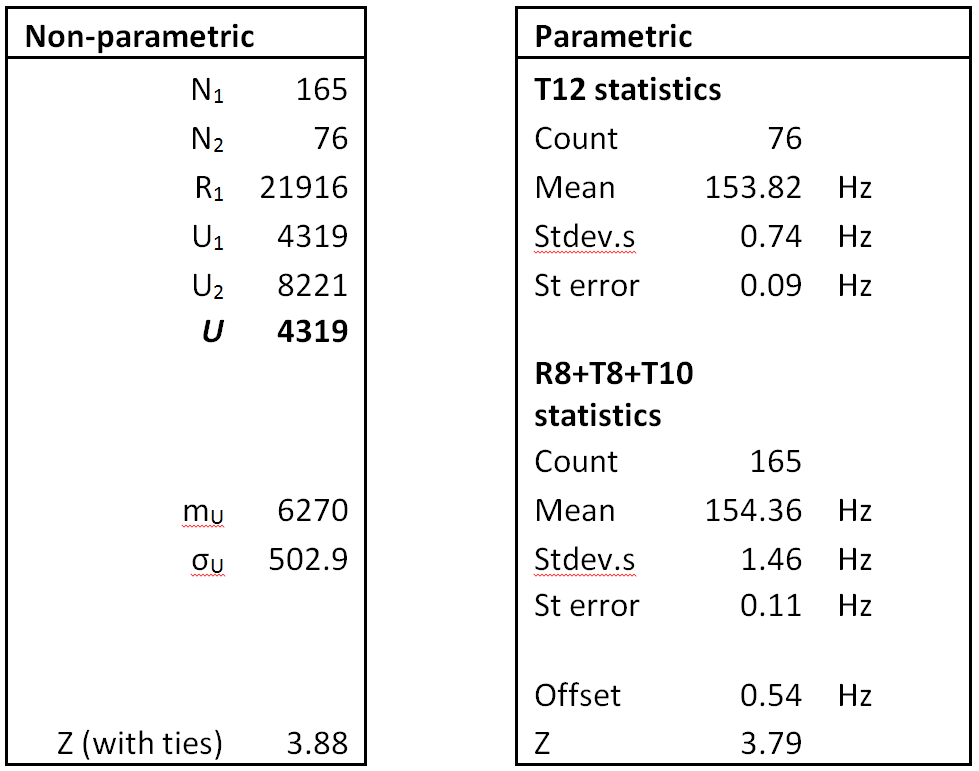
Table 6: Testing for differences between mean FFBs for
channel T12 vs channel combination R8+T8+T10
The descriptive statistics for the resulting channel combinations are given Table 7.
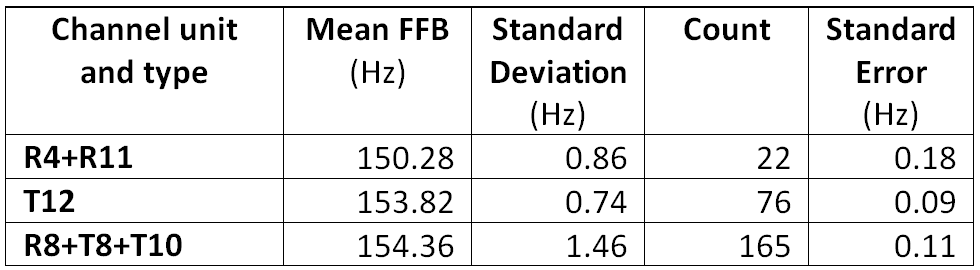
Table 7: FFB Descriptive Statistics after Stage 2.
In the flight path analysis the principal statistics that are used are the means and standard deviations for the channel number and type associated with the BFO applicable to the phase of flight under investigation. These statistics are depicted in Figure 4, illustrating the detailed distinctions obtained from both the Stage 1 and Stage 2 analyses.
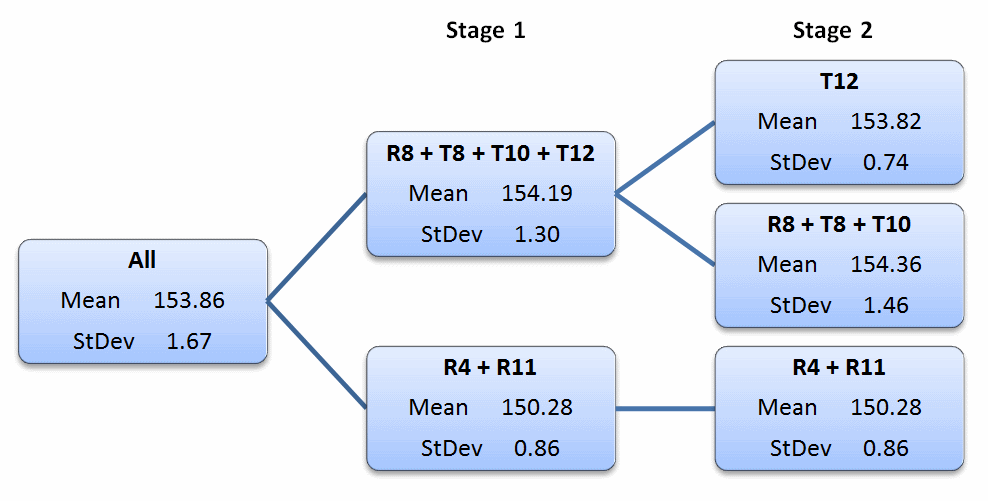
Figure 4: FFB means and standard deviations for
identified channel groupings
Figure 4 shows how an all-channel mean of 153.86 Hz first becomes split into two groups, with a -3.9 Hz difference between R4 + R11 and the remaining channels. The remainder then are split into two further groups, with a -0.54 Hz difference between T12 and the other channels.
Discussion and Conclusion
The findings from the Stage 1 analysis appear to be particularly robust and support the broad findings of the ground-based analysis, at a high level of statistical significance. Alternative forms of Stage 1 segmentation, such as a simple split by channel type, did not provide the same level of discrimination. The results from the Stage 2 analysis are currently tentative, and the level of discrimination that it provides is modest. Pending a deeper understanding of these issues, it is recommended that only the results from Stage 1 should be used in MH370 flight path analysis.
References
[1] Rydberg, H. (2014): PAR5 satellite vectors/ephemeris
[2] ATSB (2014): ATSB report June 2014 updated August
[5] Welch t-test