Optimal Gliding Descent Scenarios for MH370
Geoff Hyman, Barry Martin and Sid Bennett
14 July 2015
(Updated 15 July 2015)
Introduction
In this note we focus on the final descent of the flight of MH370 and explore the implications of an assumption that the last stage thereof was executed in the form of a glide rather than a spiral descent.
Glide scenarios are of interest because they may assist in the identification of an outer boundary of the search area. Whether MH370 descended in the proposed manner is not resolved here. On the other hand, lack of success in terms of finding the aircraft within the current priority area further raises the interest in plausible alternatives.
On best-available interpretations of the available satellite and flight simulator evidence, optimal glide scenarios represent extreme cases and would not be considered to be the most likely ones to have actually occurred. However, as long as glide scenarios, in some form, are a reasonable possibility, the implications for the search area merit further consideration.
This study was motivated by a proposal that, if under (human) pilot control, MH370 could have continued on an efficient gliding path after passing the 7th arc (00:19:29 UTC; all times herein are UTC). Previously [1] we explored an apparent anomaly in the BTO/BFO observations associated with the re-log-on event at 18:25 and SATCOM handshake transmissions shortly afterwards, concluding that an offset track might have been the cause. Such scenarios would have required human input after the time of final primary radar contact. Combining such considerations with the analysis reported in [2] provides a motivation for the scenarios examined here.
The present study considers a scenario involving events subsequent to 00:11, but there are only two satellite observation pairs available: at 00:11 and at 00:19:29. Inmarsat engineers [3] are confident that the corrected 00:19:29 BTO is usable. The assessment of alternative flight paths after 00:19:36 is problematic because no further BFO or BTO values were recorded. The current simulations are computed in 15 second time increments and are divided into two parts: the first is for the period with satellite observations, from shortly before 00:11 until 00:19:30; and, the second is an extrapolation of the position at 00:19:30 to the end of the flight.
The likelihood of MH370 having executed a simple glide descent, resulting in the aeroplane being ditched at considerable distance from the 7th arc, is conditional upon rejecting the validity of the BFO at 00:19:29 as it is presently understood [3]. The BFO measurement is a part of the handshake during a re-log-on event with the Inmarsat ground station at Perth and we do not have sufficient comparative data to determine whether the BFO anomaly referred to by Inmarsat for the log-on sequence at 18:25 should be considered in this circumstance as well. Further data from the ATSB relating to the log-on events would be welcome, including comparable data from similar flights. If the BFO measurement during the re-log-on (at 00:19:29 ) were to be determined to be valid, then the descent scenarios could be complex, and less efficient, with shorter ranges and/or reduced times aloft.
One consideration was the conflicting initial assessment of the location of the intersection of the flight path with the 7th arc. Subsequently, our group has reported a number of studies that strongly suggest that the location of that intersection is quite well established. This intersection may be some appreciable distance from the final location. However, with due recognition of the uncertainty of the descent trajectory, this still facilitates a more focused review of the future search area.
The current report also incorporates improvements to wind modelling, informed by [4]. It also includes refinements to deal with the brief period for which only one engine was operating.
Optimal Glide Scenarios
We consider two possible types of optimal glide scenario: maximum range and maximum endurance. The associated altitude profiles for speed and descent speeds are based in the relationships given in annex A below. These profiles are based on a drag model for the airframe alone which does not account for drag contributed by windmilling powerplants.
For the one engine inoperative (OEI) case the single engine thrust also needs to be incorporated. However this only applies to a brief period of the descent and is not reported here.
In Figure 1 we show a distribution of likely flight directions at the commencement of the glide stage. For the maximum range scenarios there are two modes (or peaks), while maximum endurance scenarios show a single peak.
Our previous studies indicated that the most likely flight azimuth, prior to the 6th arc, was 186 degrees True (i.e. six degrees to the west of due south). It appears that, after the second engine flame out, the aeroplane probably made a turn to the left through an angle of at least 20 degrees; alternatively our speed assumptions during the loss-of-power event might be too low. For both sets of glide scenarios the median azimuths are similar, the main differences being their implications for the distances flown beyond the 7th arc.
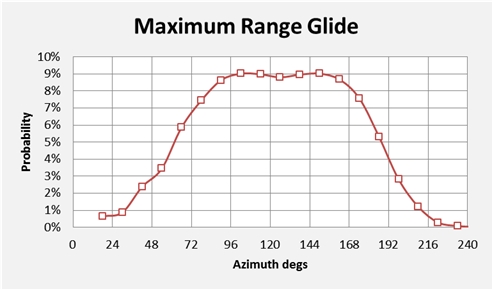
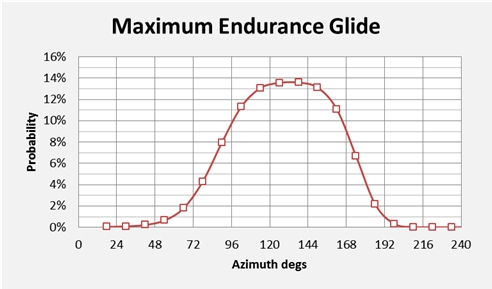
Figure 1: Initial direction for the Glide: a) Best Range; b) Best Endurance.
In Figure 2 we give a plan view of the simulated flight paths and the locus of sea level endpoints. The square labelled as IG nominal was reported in [5] as the intersection with the 7th arc, without consideration of a subsequent descent, and is included to assist orientation of this result with respect to previous studies.
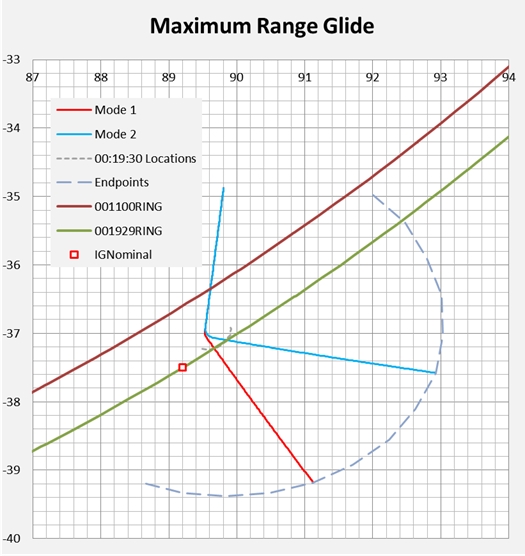
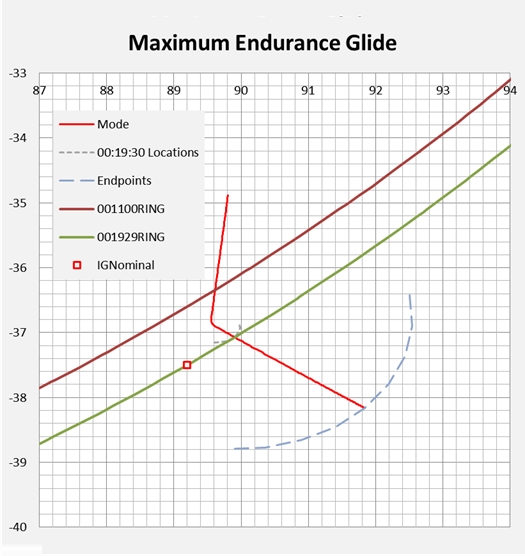
Figure 2: Sample Flight Paths and Spread of Probable Endpoints.
In Figure 2 the maximum glide range may be considered as encompassing the region between the lines labelled Mode 1 and Mode 2. The maximum endurance path is shown as a single median line. As the distribution of angles in each case is fairly broad, based on Figure 1, a specific radial vector for the search is not suggested.
Summary of Model Inputs and Outputs
In all scenarios our modelled speeds begin to reduce one minute prior to the commencement of the descent. However, the speed reduction process after fuel exhaustion for the first engine does not have time to reach its optimal OEI speed before fuel exhaustion occurs in the second engine.
Our model inputs are listed in Table 1 below, along with the consequent outputs.
In reference [6] (specifically on page 26) the ATSB estimated a glide range of 120 NM for a descent from 35,000 feet. Our Table 2 below shows a comparison between the glide stages for our sample flight paths and the ATSB’s assumptions. The maximum range Mode 1 scenario covers a similar distance and has a similar gradient to the ATSB’s values. The differences shown are within the errors of our modelling approximations.
The maximum range scenario for Mode 2 has a larger range and a flatter glide path due to the presence of a tailwind in our simulated flight path. The maximum endurance scenario covers a shorter distance, and but has a similar gradient to that of the ATSB report [6].
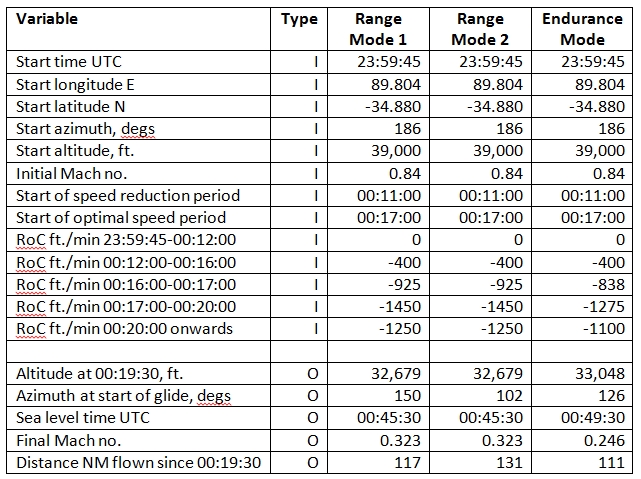
Table 1: Summary of Principal Inputs (I) and Outputs (O).
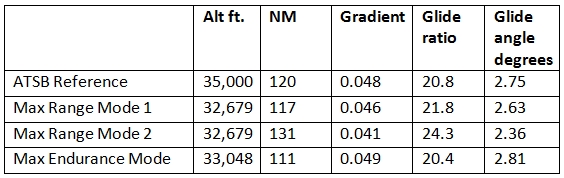
Table 2: Comparison of Glide Ratios with the ATSB’s Estimates [6].
Discussion
These scenarios excluded the BFO data at 00:19:29, which has been interpreted to be consistent with a rate of climb (RoC) of about
–4500 feet per minute (i.e. a rapid descent), whereas the RoC for the scenarios studied is about one quarter of this value, as is to be anticipated for a glide. As there are no further usable satellite data for later times, the possibility of a less efficiently flown scenario with a steep initial descent cannot be excluded. This would have the effect of decreasing the range that would be flown after fuel exhaustion (i.e. in the glide phase).
Conclusion
We have illustrated two glide range descent scenarios: maximum range and maximum endurance. The conclusions support the ATSB’s findings [6] that MH370 could have flown 120 nautical miles beyond the 7th arc. For pragmatic reasons the ATSB appears to have restricted its search area to a band located 40 nautical miles beyond the 7th arc and parallel to it. However a case is emerging that, if under the control of a pilot, the positions of impact could all lie further still from the 7th arc. Again, on best-available interpretations of the satellite and flight simulator evidence, optimal glide scenarios are not the most likely ones to have occurred, and only represent extreme possibilities. Appropriate risk analyses would be required prior to making proposals for future revisions to search area priorities.
Acknowledgments
The authors should like to acknowledge the contribution of Brian Anderson in providing assistance in checking the fuel exhaustion times. We should also like to acknowledge the contributions of Mike Exner, Victor Iannello, and other members of the Independent Group (IG) for their comments on an earlier draft. Any errors or omissions remain the responsibility of the authors.
References
[1] Bennett, S., Hyman, G. & Martin, B. (May 2015). MH370 Path Investigation Studies: The Implications of BFO and BTO Data at 18:27 UTC. Independent Group; available from: https://www.duncansteel.com/archives/1699
[2] Anderson, B. & Exner, M. (March 2015). The Last 15 minutes of Flight of MH370. Independent Group; available from: https://www.duncansteel.com/archives/1461
[3] Ashton, C., Bruce, A. S., Colledge, G. & Dickinson, M. (2014). The Search for MH370. The Journal of Navigation, 68 (01), 1–22. Available from: http://dx.doi.org/10.1017/S037346331400068X
[4] (U.S.) National Centers for Environmental Prediction/National Weather Service/NOAA/Department of Commerce, NCEP FNL Operational Model Global Tropospheric Analyses (continuing from July 1999): Research Data Archive at the National Center for Atmospheric Research, Computational and Information Systems Laboratory, Boulder, Colorado. (Updated daily.)
[5] Steel, D. (ed.) (September 2014). MH370 Search Area Recommendation. Independent Group; available from: https://www.duncansteel.com/archives/1023
[6] ATSB: MH370 – Definition of Underwater Search Areas. External Aviation Investigation AE-2014-054 (26 June 2014; updated 18 August 2014); available from: ATSB: MH370 – Definition of Underwater Search Areas
[7] Vinh, Nguyen X. (1993). Flight Mechanics of High-Performance Aircraft. Cambridge Aerospace Series. Cambridge: Cambridge University Press.
[8] Pereira, R. L. (2010). Validation of Software for the Calculation of Aerodynamic Coefficients. Degree project, Linkȍping University, Sweden; available from:
http://www.diva-portal.org/smash/get/diva2:329418/fulltext01.pdf
[9] Jenkinson, L., Simpkin, P. & Rhodes, D. (2001). Civil Jet Aircraft Design. [Data sets] Butterworth-Heinemann; available from: http://booksite.elsevier.com/9780340741528/appendices/default.htm (accessed 5th June 2015).
[10] Malaysian Ministry of Transport (2015). Safety Investigation for MH370: Factual Information, issued 08 March 2015; updated 15 April 2015; available from: http://mh370.mot.gov.my/
Annex A. True Airspeeds and Decent Rates for
Best Range and Endurance
The drag force is assumed to be given by an equation of the form:

…where V is the true airspeed, and z is the altitude. The coefficients are given by:

…where ρ(z) denotes the (ISA) density of air at altitude z and the remaining parameters are as in Table A.1 below.
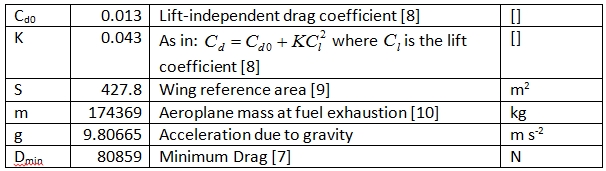
Table A.1: Parameters Pertaining to the Drag Force
Drag coefficients K and C_d0, reported in [8] and reproduced here in Table A.1., are for the Boeing 777-300 model without operating powerplants, at Mach 0.84 and a Reynolds number of 8.7 × 10^5.
Maximum Range Descent
The airspeed which maximises range, in the absence of winds, is given by:
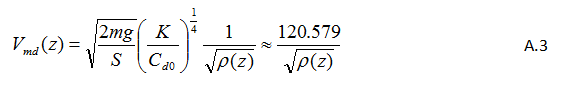
In the absence of engines the steady-state rate of descent, which maximises range, is [7]:
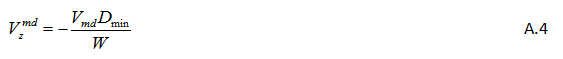
…where W=mg is the aeroplane weight, and

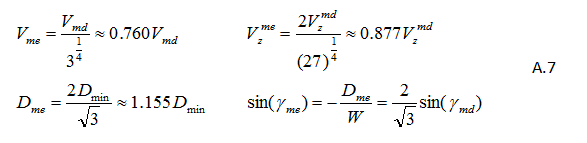
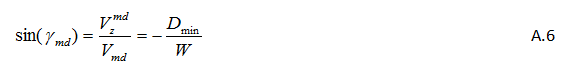
…is the minimum drag. The glide angle γmd for this maximum range steady descent is then given by:
Maximum Endurance Descent
For maximum endurance (i.e. longest descent time) we can write the following relations (see reference [7]) so as to get the equivalent output parameters as in equations A4, A5 and A6 above: