New Zealand and the
Fifth Domain of Warfare: Space
Duncan Steel
2015 May 14
A submission to the public consultation for the
New Zealand Defence White Paper 2015
A PDF version of this submission (523 kB) is available from here.
Summary
Geography, in terms of the supposed remoteness of New Zealand, is often cited as a reason why this country does not need a strong Defence Force. However, as I indicate in this brief submission, it is in fact geography that must surely lead to NZ playing a major role as humankind’s activities in outer space grow to include warfare, as already happens to be the fact.
The core geographical reason is this. The majority of satellites orbit the Earth in the prograde direction, from west to east. The nations that presently have orbital or sub-orbital (i.e. ICBM) launch capabilities, or are expected to do so soon, and which might be anticipated to be possible adversaries of NZ and its allies, are essentially all in Asia; for example, China, North Korea, Russia, Pakistan, Iran. Prograde orbits mean eastward launches. Simple physics dictates that rockets launched eastwards from Asia will turn southwards, cross the equator, and on first pass will cross the southern Pacific. In fact, if one draws a line from NZ’s sub-Antarctic islands to the northernmost part of the Realm of New Zealand (i.e. the north of the Cook Islands, and Tokelau) then it is almost inevitable that satellites launched by Asian nations will cross that line on first pass, this being the time (about 30 minutes post-launch) that NZ’s allies in North America and Europe would need to have such objects detected and tracked if they are to be informed in advance of the approach of potentially-hostile spacecraft.
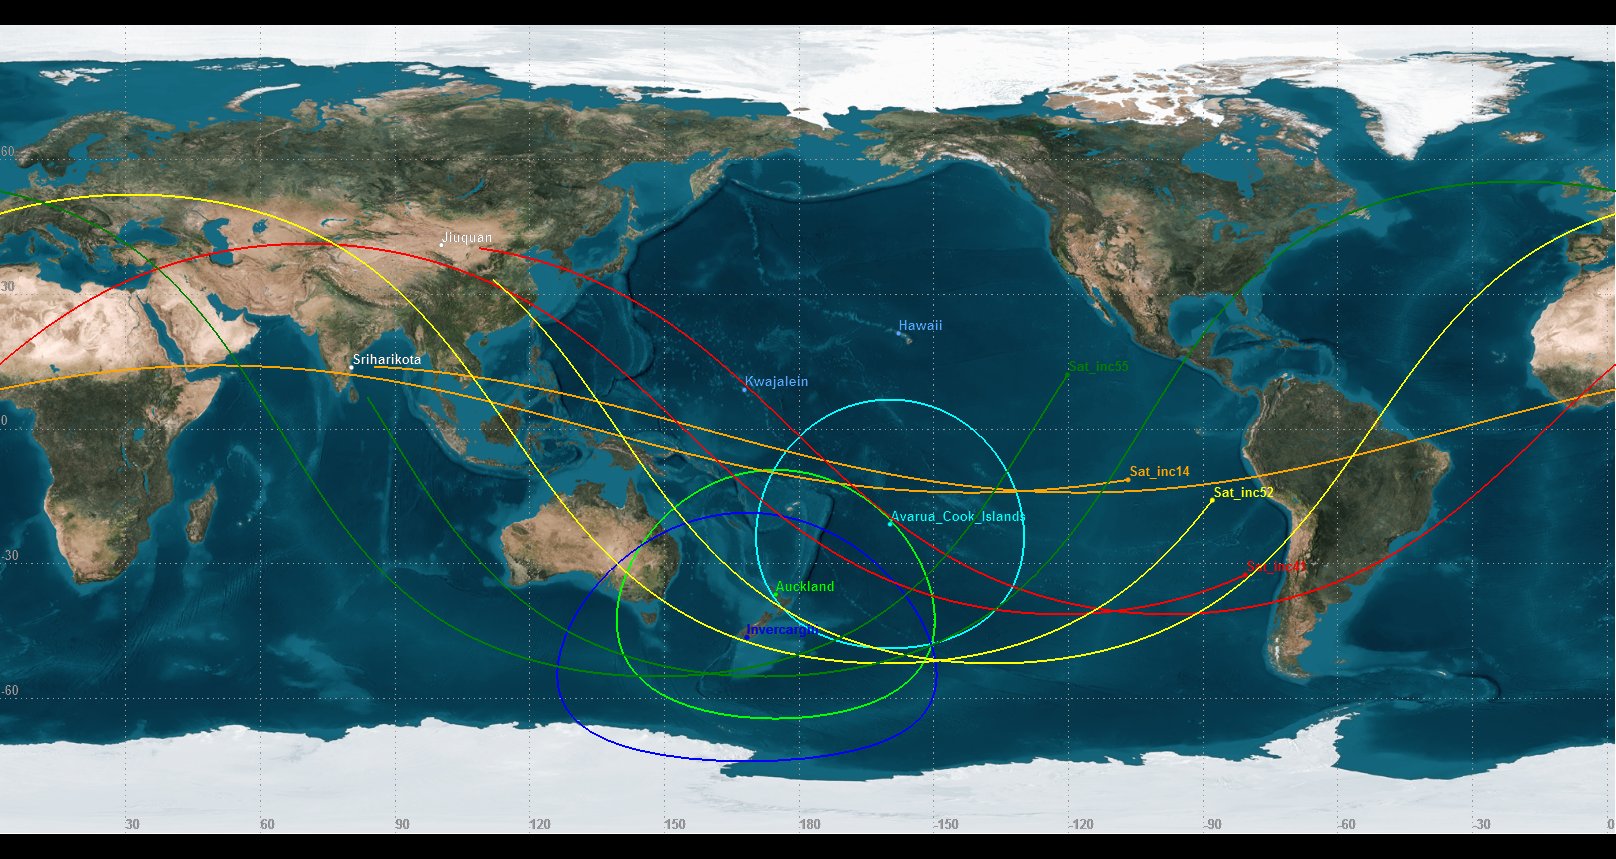
I give simple examples in the map below. I have shown orbital tracks (at altitude 500 km) for two launches each from the Chinese launch site at Jiuquan, and the Indian site at Sriharikota. For each launch site I have shown one satellite launched due east, which then has an orbital inclination (tilt to the equator) equal to the latitude of the site: 41 degrees for Jiuquan (path in red) and 14 degrees for Sriharikota (path in orange). I have also shown a more highly-inclined satellite launched from each site: inclination 52 degrees (in yellow) from Jiuquan, and 55 degrees (in green) from Sriharikota. I have additionally drawn three rings (actually circles of radius near 3,000 km, but distorted in this 2D mapping) to indicate potential coverage of suitable radar systems located at Invercargill, Auckland and Avarua (Cook Islands): these would, between them, be capable of tracking all four satellites.
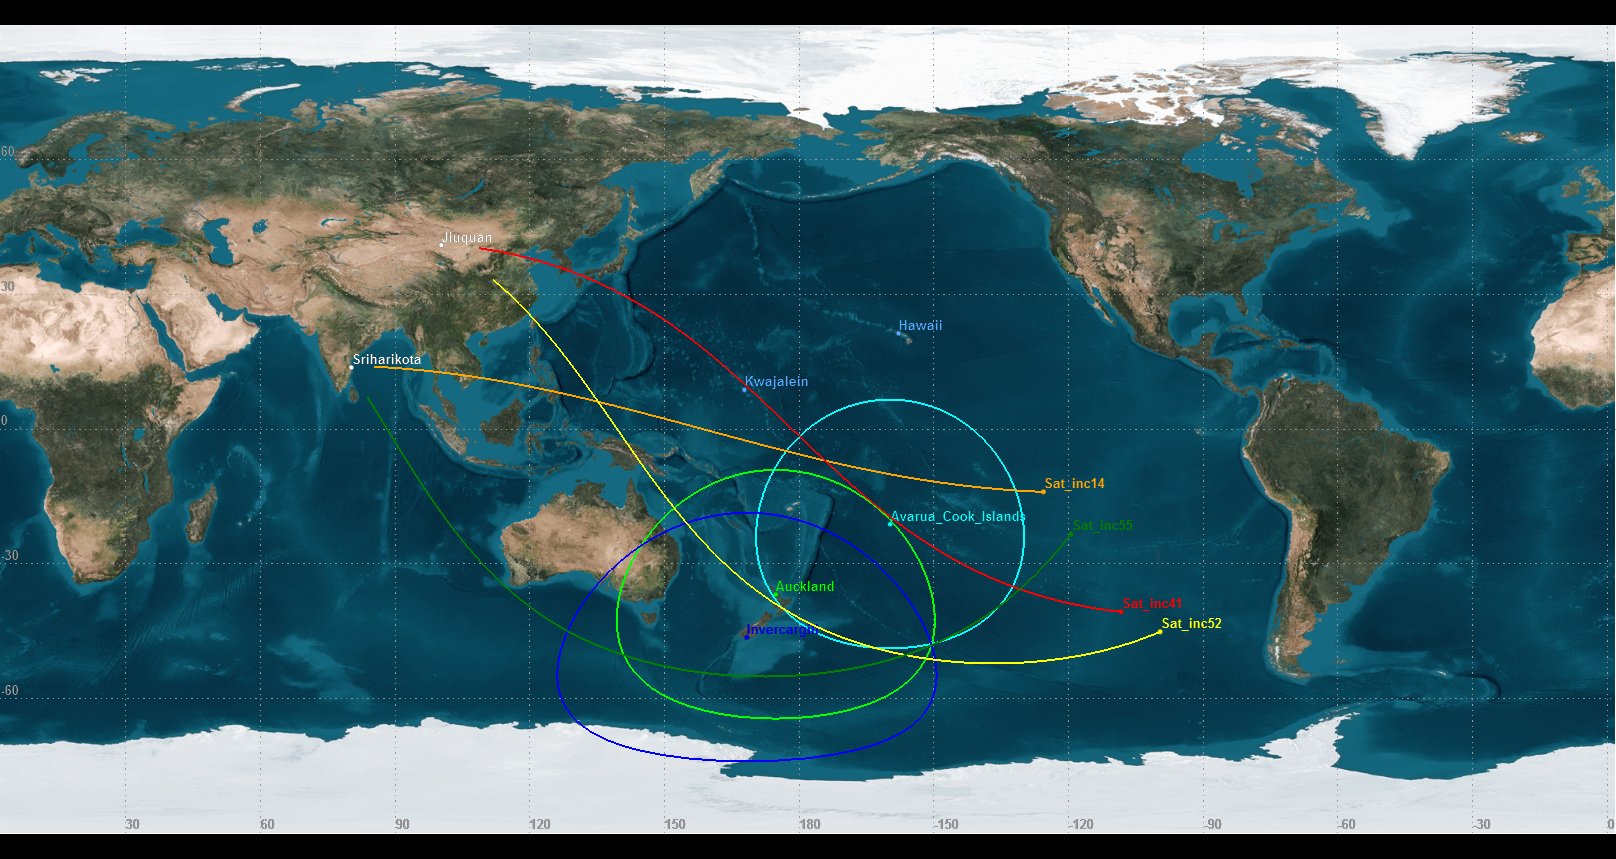
Also shown in this diagram are Kwajalein (Marshall Islands), where the US DoD is to build its new Space Fence radar mark II (cost US$2 billion and growing); and Hawaii, where the USAF maintains an optical tracking facility on Maui. Such US assets would not be able to track the two of these satellites that travel furthest south.
Finally I note that the US and Australia have recently entered into a Space Situational Awareness (SSA) agreement involving various assets being installed and operated in Australia, but tracking of such satellites by these assets will not be feasible on first-pass. It is only NZ-sited sensors that could guarantee coverage of potentially hostile rockets and satellites crossing the southern Pacific.
Introduction
During the 20th century a third domain of warfare (Air) was added to the two ancient domains, Land and Sea. As we entered the 21st century a fourth domain was recognized and added: Cyberwarfare.
It should be obvious, however, that a fifth domain has already entered the fray, whether we like it or not. This domain is outer space. Modern armed forces depend to a large extent on satellite-borne communications for various aspects of their C4ISR. The race to the Moon in the 1960s was clearly not about science and exploration alone, and now a new space race is beginning. A quest for military domination of outer space seems unavoidable.
That this 21st century space race involves more than simply national prestige is obvious. As Sun Tsu wrote more than two millennia ago, “All armies prefer high ground to low, and sunny places to dark.” Space is the ultimate high (and indeed sunny) ground. In modern times (2007) the Chinese have already executed a hostile action in space, an anti-satellite demonstration that has left the densely-populated altitudes between 800 and 900 km – an especially important height bracket due to its utility for sun-synchronous orbits – badly polluted with debris from the meteorological satellite that they destroyed using a ground-launched missile.
The tracking of such debris, and all orbiting objects, is conducted by the US DoD through a variety of optical and radar sensors, and the information database is maintained by the Joint Space Operation Center (JSpOC). Sensors include various optical systems such as the GEODSS cameras spread around the globe, and also the former Space Fence radar array that had transmitter and receiver sites located in various US states. Canada has also been a close, long-term collaborator with the US in NORAD (the predecessor to USSPACECOM and now USSTRATCOM) due to the perceived likelihood of ICBM attacks on the US being routed over Canadian territory, in the context of the Cold War.
Affairs in space and national defence have now moved on, and other potential aggressors occupy the attention of the US Government, and its allies. The US is currently building a new Space Fence radar, in Kwajalein (Marshall Islands). The choice of that remote location, rather than within the US itself, is not accidental: there is a need on the part of the US to detect and track orbiting or at least space-transiting objects coming from the west and crossing the Pacific towards the US mainland. Similarly the US wishes to locate early-warning radars in Romania and Poland because ICBMs launched by Iran (for instance) would travel over eastern Europe before passing over the Arctic en route to the USA via geodesic paths.
Since the beginning of the Space Age almost 60 years ago two of the Five Eyes nations, the UK and Canada, have worked closely with the US in military space projects, in particular Space Situational Awareness (SSA). Over the past five years Australia and the US have concluded agreements on SSA in the annual AUSMIN meetings. Specific actions now underway include: (a) The shifting of the prototype Space Surveillance Telescope (SST, the largest camera ever built, at a cost of around $200 million) to the northwest cape of Australia (i.e. Learmonth); (b) The installation of a C-Band radar near Darwin for the detection and tracking of satellites and debris in orbit; and (c) Planning for an additional Space Fence radar to be located in Western Australia.
This means that NZ is the only one of the Five Eyes nations not directly involved to any significant extent in space tracking activities. However, as I show below, the geographical location of New Zealand and its Realm – east of Asia and south of Kwajalein and Hawaii – results in a realisation that this is a vital range of locations for the operation of suitable sensors, tracking orbiting objects in general and satellites on first pass post-launch in particular.
Optical Sensors
I will write comparatively little here about NZ as a likely location for optical sensors for tracking objects in geocentric orbit; that is, narrow-field telescopes and wide-field cameras. What I will note is that Mount John Observatory at Lake Tekapo is the southernmost year-round professional astronomical observatory in the world, having just passed its 50th anniversary.
Despite the well-known vagaries of cloud cover in the Southern Alps, and indeed NZ as a whole, Mount John would be an excellent candidate location for suitable telescope systems similar to those the USAF maintains and operates at the AMOS (Air Force Maui Optical and Supercomputing observatory) site on Maui. In terms of the needs of modern astronomy, Mount John is not a competitive site; but neither is anywhere in Australia (and yet the SST is to be installed at one of the poorest ‘astronomical’ sites in that country), and in any case we are not talking about abstract astronomy here. The tracking of Earth-orbiting objects is a different game. What Mount John has in its favour is its latitude, and longitude.
The history of the USNO operating a small telescope at Black Birch (near Blenheim) is well-known.
Finally under the heading of ‘optical sensors’ I note that the Australian DoD has been supporting for some years the use of LIDAR (laser radar) systems for the tracking of orbiting objects, through the activities of the Canberra-based company Electro-Optic Systems.
Space Radars
My main intent in this submission is to illustrate how and where suitable radars might be located such that NZ might independently make a major contribution to the Five Eyes SSA capabilities. I am not suggesting that the US (or anyone else) be invited to locate sensors of any type, or conduct SSA operations of any form, within New Zealand. What I outline here is a space situational awareness capability that NZ should be able to design, construct and operate on its own, with a range of likely benefits to the nation that I will discuss in a later section of this submission.
In the map included in my summary section above I showed orbital tracks (at altitude 500 km) for two launches each from the Chinese launch site at Jiuquan, and the Indian site at Sriharikota. For each launch site I employed one satellite launched due east, which then has an orbital inclination (tilt to the equator) equal to the latitude of the site: 41 degrees for Jiuquan (path in red) and 14 degrees for Sriharikota (path in orange). I also showed a more highly-inclined satellite launched from each site: inclination 52 degrees (in yellow) from Jiuquan, and 55 degrees (in green) from Sriharikota. These were not chosen randomly: it happens that such inclinations lead to ground tracks which, as the spacecraft ascends to attain orbit and drops its upper stages, do not pass over the territory of other nations: look carefully at those yellow and green tracks.
Additionally I drew three rings (actually circles of radius near 3,000 km, but distorted in these 2D maps) to indicate potential coverage of space radars located at Invercargill, Auckland and Avarua (Cook Islands): these would be capable, between them, of tracking all four satellites. The positions shown for the satellites in that first map are all about 30 minutes post-launch, on their first pass over the Pacific.
Also shown in these diagrams are Kwajalein (Marshall Islands), where the US DoD is to build its new Space Fence radar mark II; and Hawaii, where the USAF maintains a major optical tracking facility on Maui (AMOS). Such US assets would not be able to detect and track all of these putative satellite launches on first pass.
In the map below I have stepped forward 60 minutes. The tracks show how two of these spacecraft/rockets, if they had a hostile intent, might have attacked the east coast of the US, or Europe.
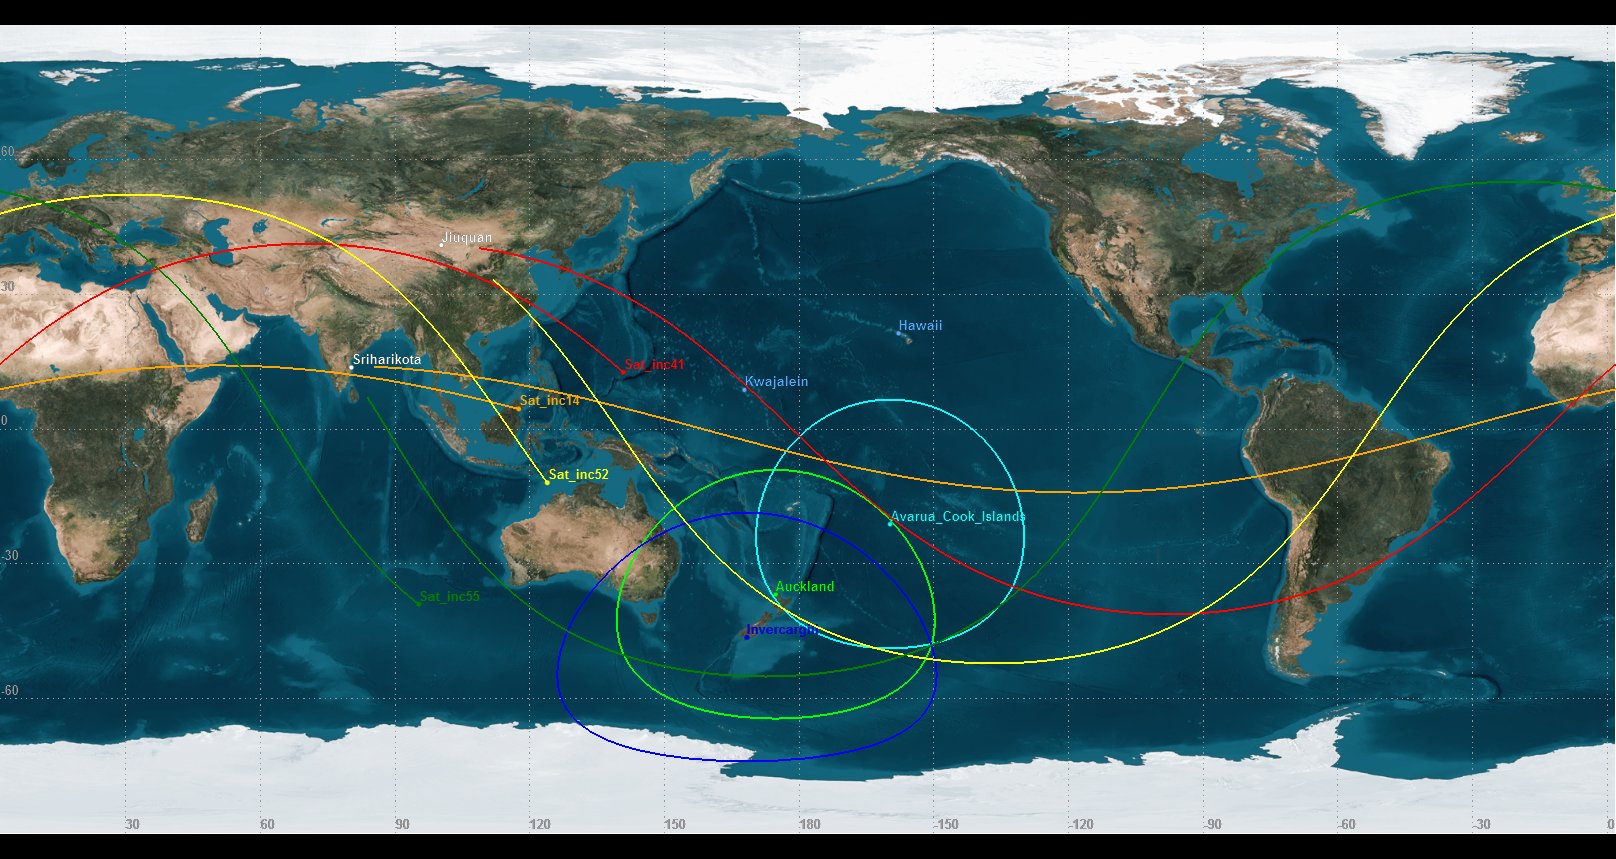
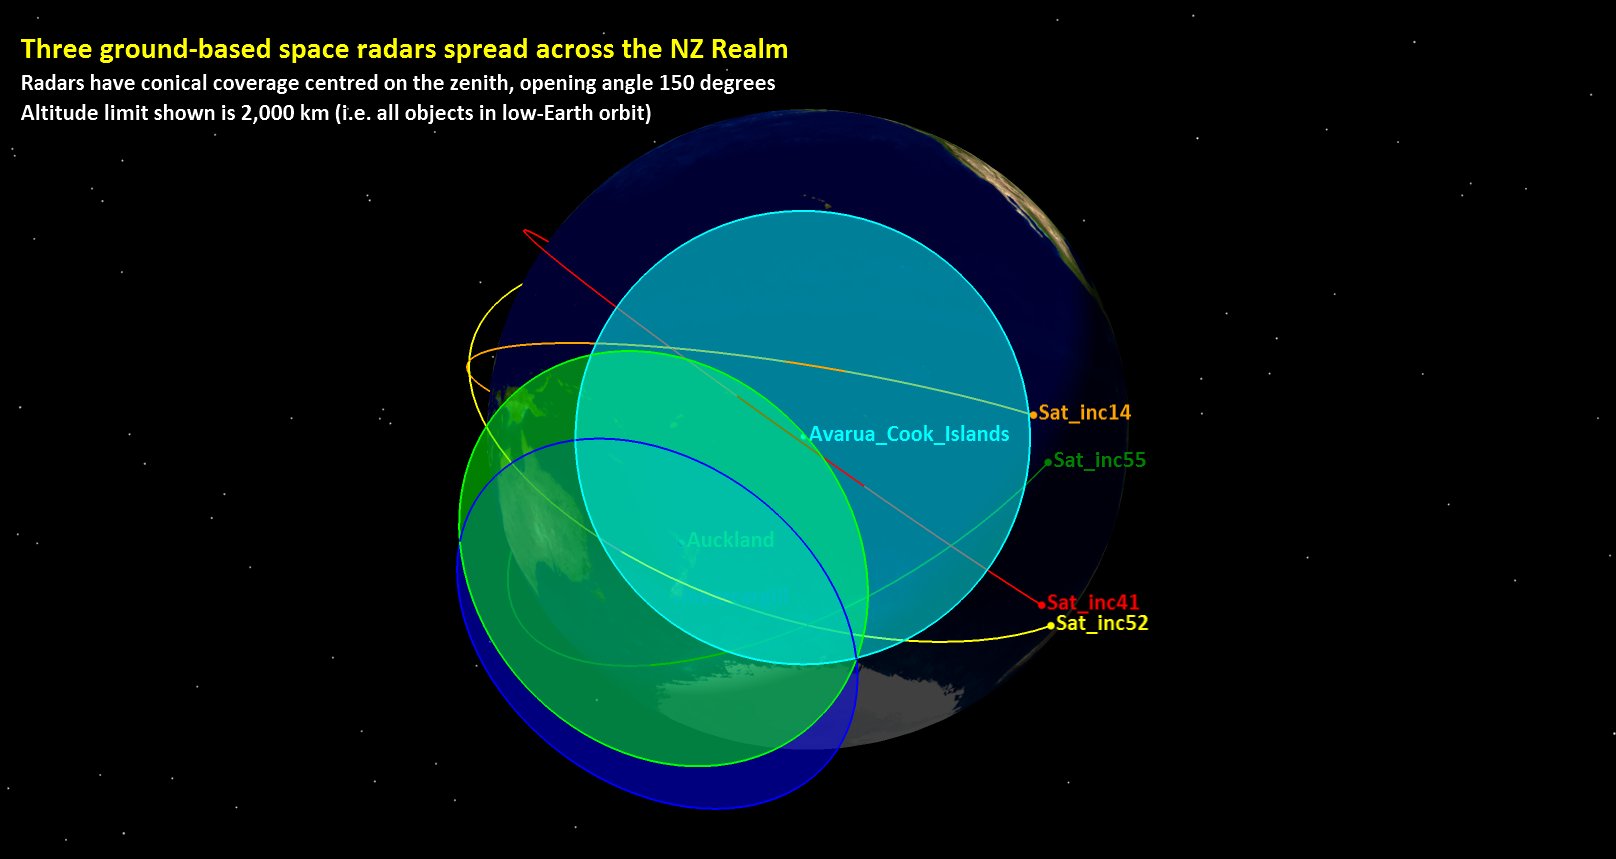
Stepping forward another 40 minutes (i.e. a little more than two hours post-launch) the satellites have passed again through the putative radar coverage available from Invercargill, Auckland and Avarua, as shown in the map that follows. One (the green track) is heading fairly centrally for the US and yet has not been within the range of the US Space Fence on Kwajalein, nor AMOS. It should be apparent from this that there is a need for suitable radar coverage in the southern Pacific, not just the north.
It would be appropriate here to indicate the type of radar system that is being mooted. The first thing to make clear is that the radar systems involved here are entirely different from the Australian OTHR JORN system, which operates on completely different principles, uses much lower frequencies (MF/HF), and has entirely different intended targets (slow-moving ships and aircraft).
The original Space Fence, spread across the Continental USA, operated in the top end of the VHF band, at frequencies near 217 MHz, corresponding to a wavelength near 1.4 metres. Due to the scattering properties of small objects, this was relatively insensitive to the weak echoes from objects much smaller than that, whereas most space debris fragments are of 10 cm sizes and smaller. Consequently the new Space Fence will be operated in the S-band (circa 3 GHz; decimetre wavelengths). This is quite a different technology to the previous Space Fence, and hugely expensive.
From the perspective of NZ’s possible role, it is the early identification of intact (therefore large) satellites that is important, and so a VHF radar operating between 200-300 MHz would seem appropriate. The detection and tracking of smaller debris items, as the US will be accomplishing from Kwajalein, is a different task that speaks to spacecraft safety. Of concern to NZ should be potentially-hostile or dangerous satellites passing above the nation, and its realm, and posing a threat to its allies.
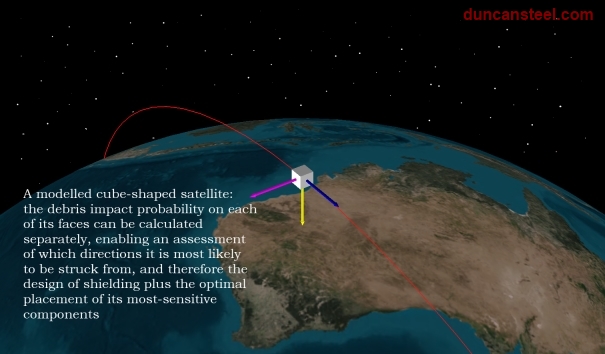
In the three-dimensional graphic that follows I show the form of the radar coverage that could be delivered by radars located as in the preceding maps. Each radar I have modelled as having an upward-directed broad cone of coverage, which I have cut off at altitude 2,000 km simply because that is the conventional height limit of satellites classified as being low-Earth orbiting (LEO). The opening angle of each cone is 150 degrees (i.e. each radar delivers coverage for all elevations more than 15 degrees above the local horizon). This produces a ‘base’ to the cone (i.e. at the ‘space’ end) that is about 3,000 kilometres in radius (6,000 km wide).
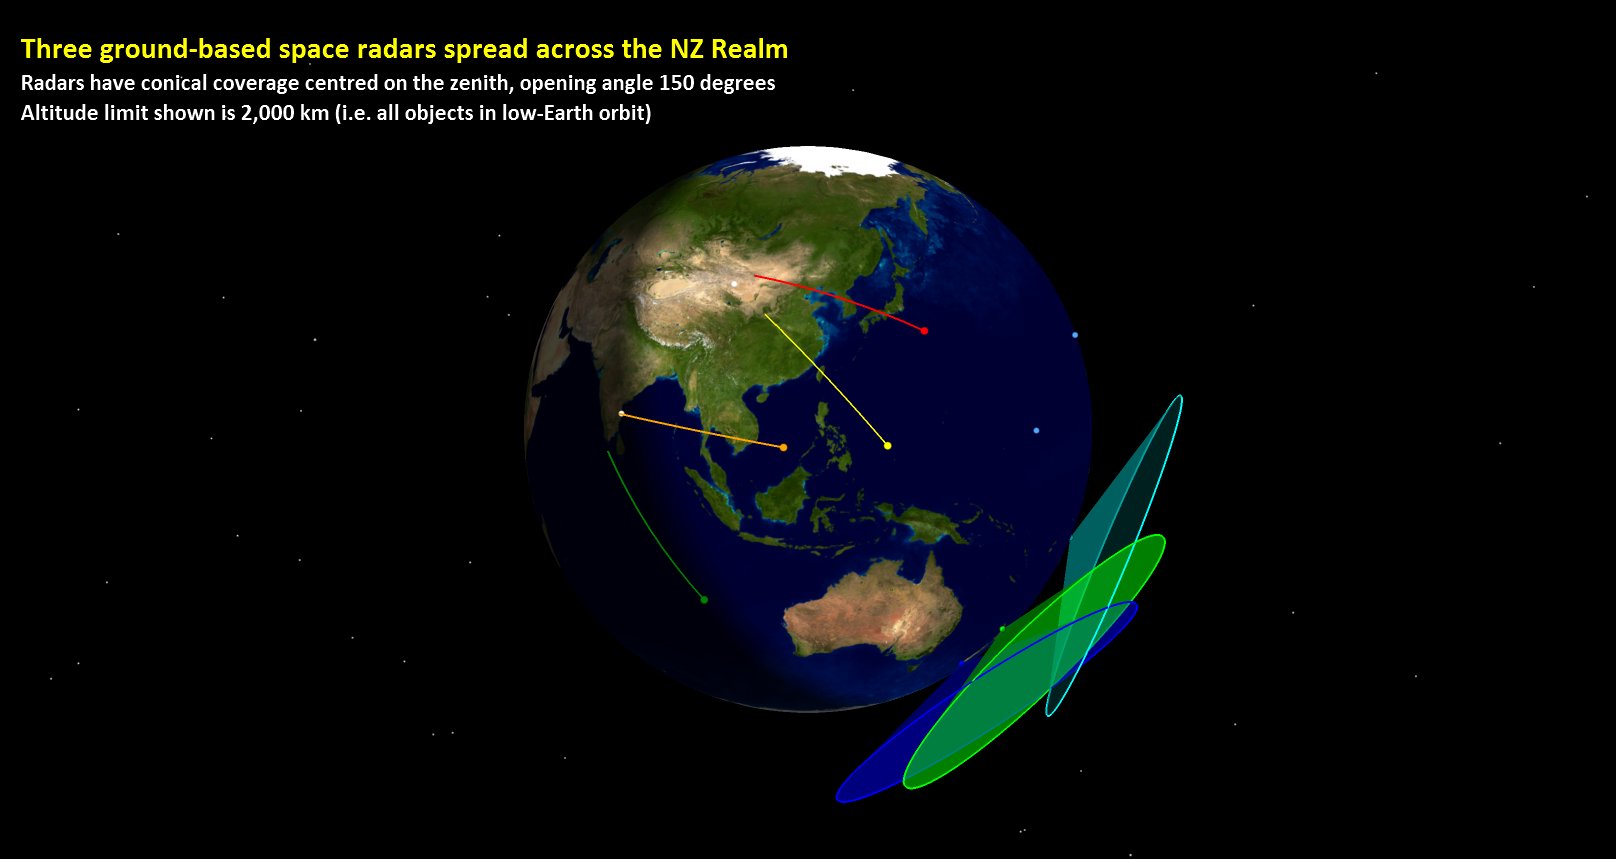
In the graphic below I have shown the four model satellite paths described earlier, as they emerge from the coverage from these three radar sites. The satellites with inclination 14 degrees and 41 degrees would have been detectable only from Avarua; those with inclinations 52 and 55 degrees would have been detectable from both Auckland and Invercargill. In all cases the satellites remain within the coverage of at least one radar for a minute or two, enabling orbit determination on this first pass, and therefore prediction of their paths over the next few hours.
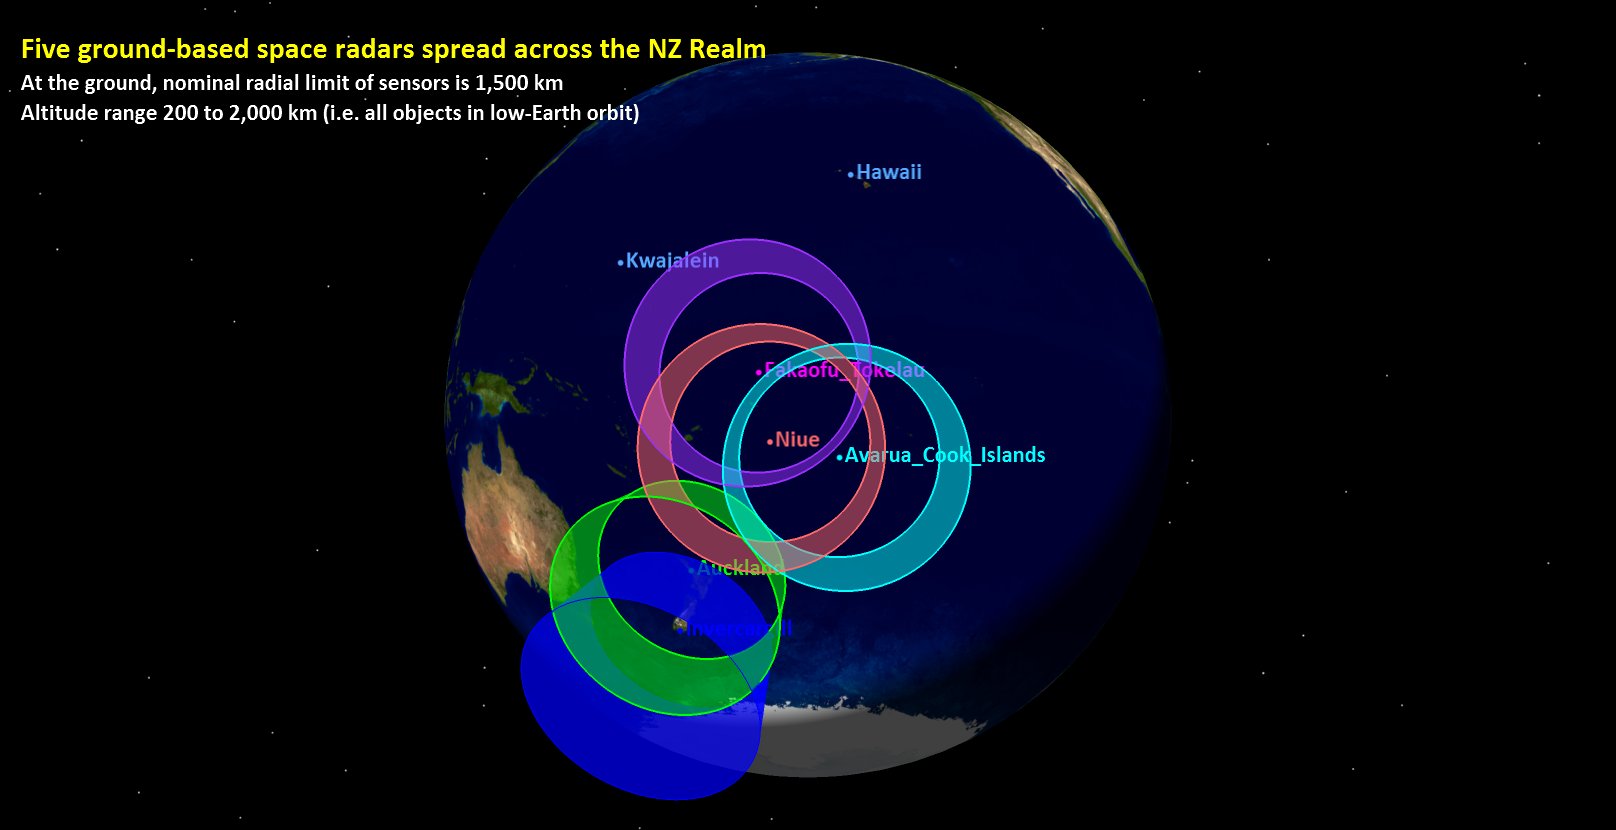
The three radar locations as modelled above would be adequate to cover satellite passes over the whole Realm of New Zealand. However, additional coverage/additional sensors are always a good idea. In the graphic below I show the coverage for five model radars (the two added being located in Niue and Tokelau), but in a different way. Now I have shown the radar coverage limits as circular ‘fences’, the bases of the fences being each located 1,500 km from its radar site, and extending over an altitude range from 200 km (no satellites stay for long below that height, due to atmospheric drag) to 2,000 km (the top of the LEO altitudes). With suitable radar equipment any satellite passing through any one of those fences would be detected, and tracking would continue during the two or three minutes the satellite was within that fence, enabling orbit determination and hand-over to other sensors in a Five Eyes network.
Arguments in favour of such a Defence capability
There are numerous arguments that could be put forward which would support the concept of developing a Defence capability for New Zealand along the lines of that proposed above. The following list is by no means expected to be complete.
1. National Security
The week before this text was being written there was a large out-of-control Russian spacecraft passing over New Zealand twice a day at an altitude below 200 km (i.e. closer than the lateral extent of NZ’s EEZ). Towards the end of its orbital lifetime it dipped down to 100 km. It eventually re-entered over the eastern Pacific on May 8th, but if that uncontrollable event had been delayed by four hours then it would have occurred as the spacecraft was crossing the South Island from NW to SE; another six hours later and it would have been passing over the length of NZ from SW to NE.
It seems that no-one in New Zealand (apart from myself) had any definitive knowledge or understanding of what was going on, with the local media simply copying what they were told by overseas sources. I see no evidence of the NZ Government having any capability to assess such threats. New Zealand has no space data sharing agreement with the US, unlike Australia (plus Japan, South Korea, Canada, France, Italy, the UK, and ESA), so that quick access to vital information (generally through Defence rather than civilian channels) cannot be obtained.
This is a startling situation, inappropriate for any developed nation. The Space Age is more than half a century old. Space is a burgeoning sphere of military activity. New Zealand is at most 45 minutes from any launch site on Earth. Thousands of orbiting objects pass over NZ every day at distances less than that between Auckland and Christchurch. This is the reality of the modern world. The requirements of National Security demand that NZ has at least some awareness of what is going on in our skies.
2. Contribution to Global Security
Consider New Zealand’s position in terms of its contribution to global security in the context of various multi-national agreements (e.g. ANZUS; Five Eyes [US, Canada, UK, Australia, NZ]; Five Powers [UK, Singapore, Malaysia, Australia, NZ]). As recent experience indicates (cf. sending of advisors and security forces to Iraq) there is widespread domestic disapproval with regard to New Zealand sending its armed forces to serve in conflicts in faraway places. This limits the contributions that the nation can make, and yet we would rely upon other larger, better-equipped nations for our own defence if there ever were a threat to NZ territory and interests.
What contribution might NZ be able to make that does not involve marked domestic opposition? The answer lies with benign activities where a special case can be made for New Zealand’s involvement. As I have indicated above, NZ’s geographical location provides such a special case; and monitoring of space surely represents a benign activity in itself. The US radar system used to patrol the high frontier is called the Space Fence; as the saying goes, good fences make good neighbours.
3. NZDF and radar
The needs of the New Zealand Defence Force with respect to radar systems is obvious. The project mooted here will lead to much upskilling, and potentially the domestic development of other types of radar system with military applications. This is what has occurred in Australia as the result of the JORN OTHR project.
4. Involvement of the Realm of NZ nations
The same geographical arguments as those raised above also apply to the Realm of New Zealand nations: the Cook Islands, Niue, and Tokelau. Although I have in diagrams above placed monostatic radar systems in each of these nations, note that bi-static or multi-static systems are feasible, even desirable, as was the case in the original US Space Fence. That is, there might be a transmitter in Avarua but receiver sites in Niue and Tokelau.
Such a network of radar systems, including sites in NZ itself, lends itself to many benefits, including international collaboration on both the military and civilian fronts, economic stimulus, upskilling of local populations (e.g. local staff being sent to NZ to obtain university education and training), and so on.
5. Involvement of the friendly neighbouring nations
Precisely the same arguments as made above for the involvement of the Realm of NZ nations can be made here for other friendly neighbours, for example Tonga, Samoa, and Fiji.
6. Inspiration and motivation for NZ students to study STEM subjects
The US is still benefiting from the Apollo space program of the 1960s, which inspired and motivated many students to enter the STEM fields (Science, Technology, Engineering, Mathematics). This echoes on in US industry. Perhaps a similar program here, on a much smaller scale, could have a similar effect.
It is well known that there is a shortage of students entering New Zealand universities to study the STEM subjects, starving local industry of the technical talents that are needed, whereas there is a huge surplus of students taking courses for which there is no direct career path. How to motivate students to study the ‘hard’ sciences and numerate subjects has been a long-term problem for many Western countries, whereas in Asian nations the industries and militaries are well-supplied with suitable graduates, providing major economic and technical advantages.
In New Zealand there have been few career paths for STEM graduates, and many of them depart overseas, never to return. This project would assist in reversing that trend, with widespread benefits.
7. Stimulus for NZ industry and universities
The project as envisaged would provide a major stimulus for NZ industry. If the radar systems in question were to be sourced and built locally, there would be a substantial requirement for R&D both on the hardware and the software (e.g. signal processing) fronts. That such projects do result in boosts for local industry is evidenced by the Australian experience over recent decades, where the needs of radio astronomy have led to technological advances largely accomplished by the CSIRO Division of Radiophysics which have had substantial commercial outcomes (e.g. better airport approach radars); similarly the JORN OTHR radar developed through the ISR Division at DSTO has led to many commercial applications.
8. Overlap into other scientific and commercial fields
Whilst the stimulus envisioned under the preceding heading was limited to radar systems, it should also be anticipated that the technological developments and weight of experience gained will lead to other benefits in separate fields. Clearly, building and operating space radars of the type envisioned would lead directly to capabilities in similar activities (e.g. satellite ground station design, construction and operation) but also a wide range of other fields such as signal processing, short- and long-range communications, plus others yet to be identified.
9. History of NZ research in radar
New Zealand has a proud and prominent history of research in radar which can be tapped. The writer is a PhD graduate of the atmospheric radar research program at the University of Canterbury, which has been in operation since the mid-1950s. Other universities and research institutions also have well-established research programs that are directly relevant, in engineering, physics, and mathematics.
10. High-profile status of space-related activity
No-one could doubt that space activities are high-profile, and generally meet with public approval. This again points to the potential of this overall capability project. NZ is too small to be involved in space in a big way, but there are niches that it can fill, to advantage. This is one of them.
11. Space-based internet
Australia is currently spending several billions of dollars on a fibre-based national broadband system. New Zealand already leads the way in terms of broadband connectivity, although there are many NZ residents not yet able to connect.
The reality is that within five or six years everyone worldwide should have broadband through satellite-based WiFi. The following graphic shows my visualisation of a satellite constellation as originally proposed by Google in 2014.
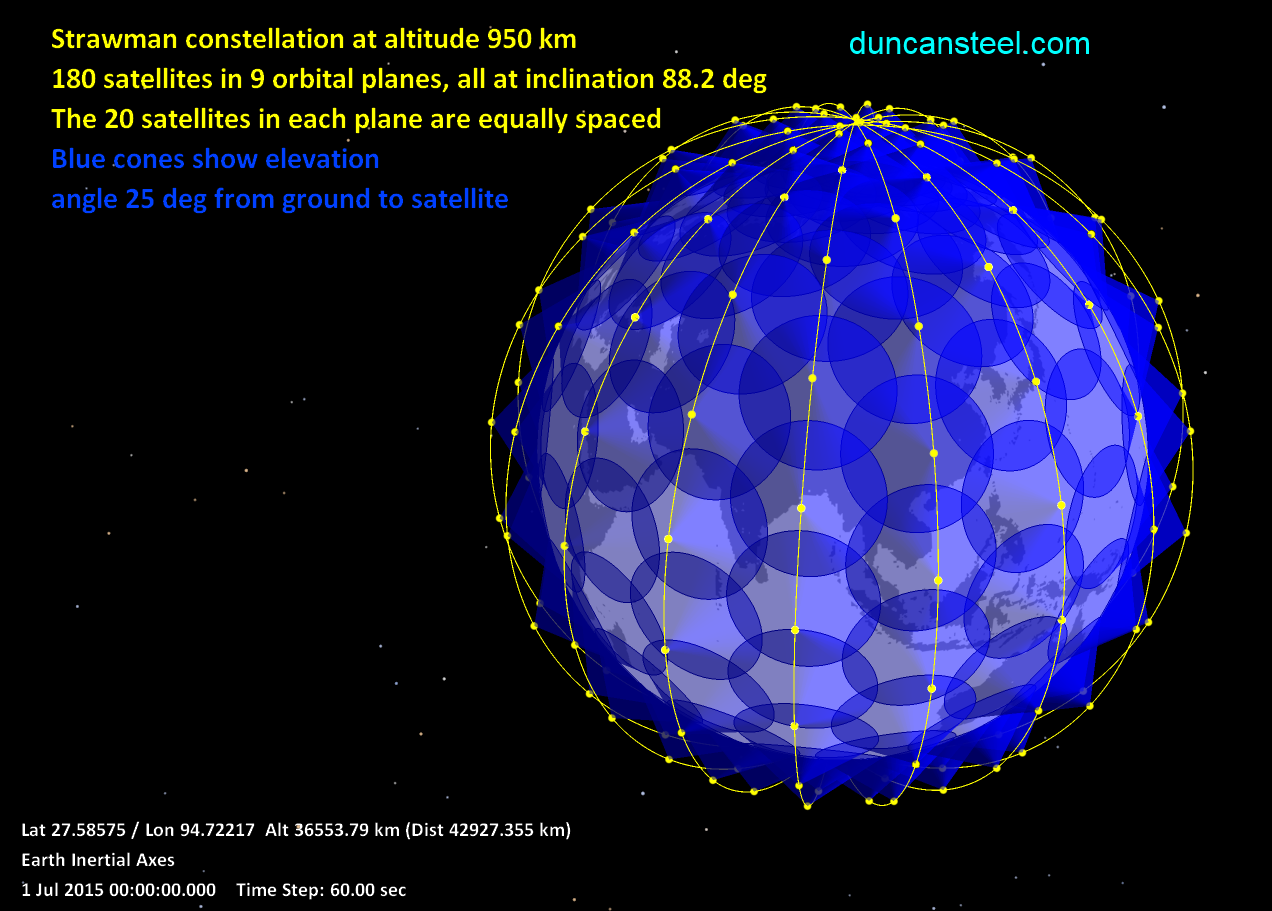
That constellation consists of only 180 satellites; SpaceX is proposing to build and launch a constellation of over 4,000 satellites to provide WiFi broadband globally. (For further information and links, see my post here.)
Such connectivity must revolutionize communications in the same way as the internet itself and smartphones have in recent years. Very soon the connected population of the world will double, as more than three billion people in developing countries get broadband access. Once that connectivity is achieved, the world will be a different place in many ways. It would seem incongruous were this to occur and New Zealand not even have a domestic capability to monitor what is flying through our skies.
Conclusion
Any and all space-linked activity such as that outlined in this submission must help New Zealand to position and prepare itself for the world’s space-linked future. Current estimates of the annual turnover of the global space industry put the figure at close to $1 trillion [sic], once one realises that the GPS systems that guide cars, jet aircraft, and trampers in the NZ bush, are all based on a satellite constellation thousands of kilometres above our heads; and that constellation is operated by the US military.
Space is the Fifth Domain of Warfare. That is inevitable, and it’s already begun. The militaries of the world largely depend on space segments for communications, for ISR, for weather forecasts, and so on. Whilst the militarisation of space is largely forbidden by UN agreements, the reality is that aggressive acts have already occurred in space; ICBMs would transit space during flight; and attacks on the ground by orbiting assets, and satellite-against-satellite attacks, may well be inevitable.
As I have shown above, New Zealand’s geographical location happens to place it under the flight path of newly-launched spacecraft from Asian nations, which will be a major concern for NZ’s allies, especially as these countries boost their space activities. The fact of this is apparent from the new arrangements between the US and Australia for space-related collaboration from a military rather than civilian perspective. North Korea and Iran have both put satellites into orbit, which is proof-positive of their long-range missile capability. Other potentially-hostile nations will surely follow.
My submission, in essence, says simply that New Zealand should recognize this fact of the next several decades, and take appropriate steps to develop a domestic Space Situational Awareness capability which would contribute in a vital way to the major facilities now being brought on-line by this nation’s core allies.
 Figure 1: The limiting (asteroid) magnitude obtainable as a function of asteroidal angular speed between 0.25 and 128 degrees per day.
  Figure 2: The logarithmic relative discovery rate as a function of asteroidal angular speed .